We have looked at a couple of monitoring solutions for your homelab, office services or hobby sites, including our series on Prometheus with Grafana (if you haven't already, check it out - it is an amazing tool duo). We have also looked at single app installations like Nagios. Today we look at another really amazing tool that is arguably a lot easier to install than the others and in my view a lot easier to understand and use. Yes, it might come with one or two limitations, but let's not get ahead of ourselves and start from the beginning, looking at Uptime Kuma.
What Is Uptime Kuma?
Uptime Kuma is a free, open-source tool designed to monitor the availability of your websites, servers, and other online services. Think of it as a regular availability check for your digital services. It evaluates the conditions you configure and can notify you after a failure. It is not an intrusion-detection system, and a passing check does not prove that every part of an application works.
How Does Uptime Kuma Work?
Uptime Kuma works by periodically checking your services using different methods such as:
- HTTP/S Requests: To check if your website or web service is accessible.
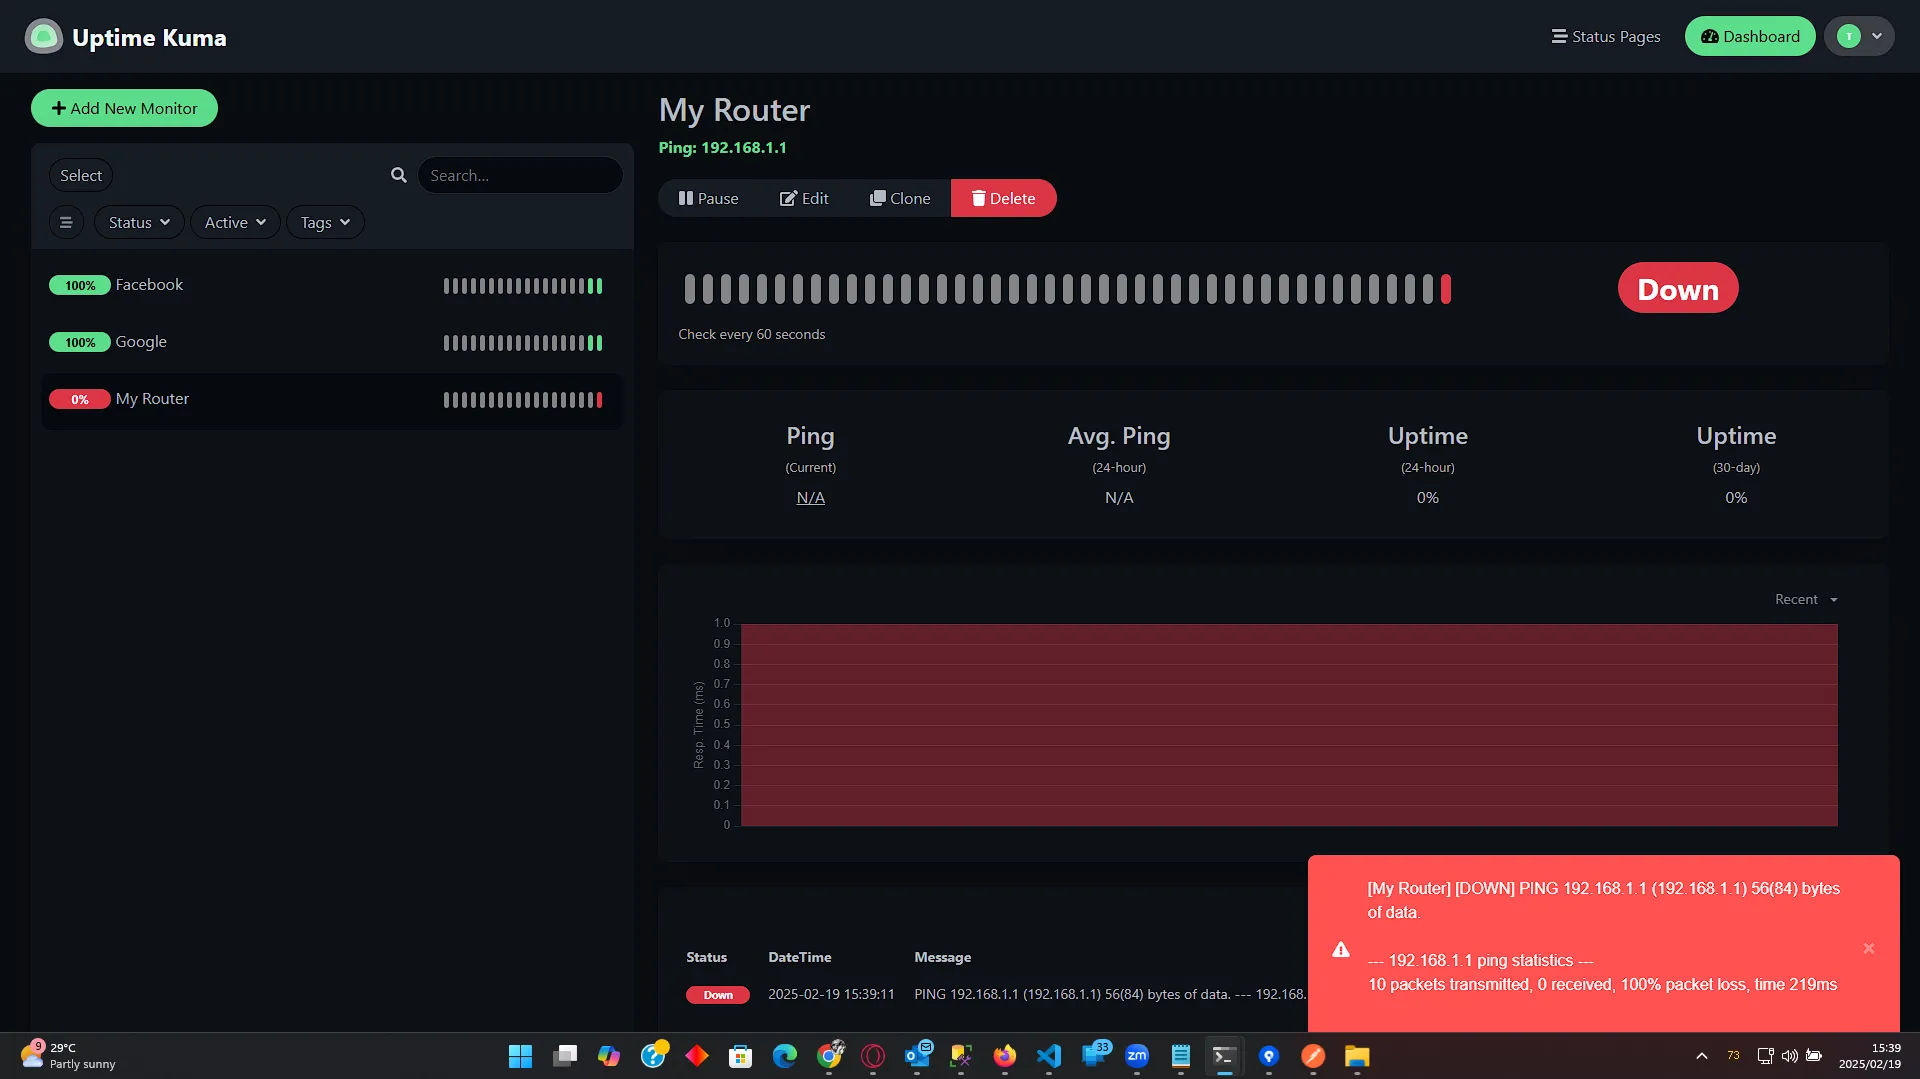
- Ping Checks: To verify the network connectivity of your devices.
- TCP Checks: To see if specific ports (like those used by your services) are open.
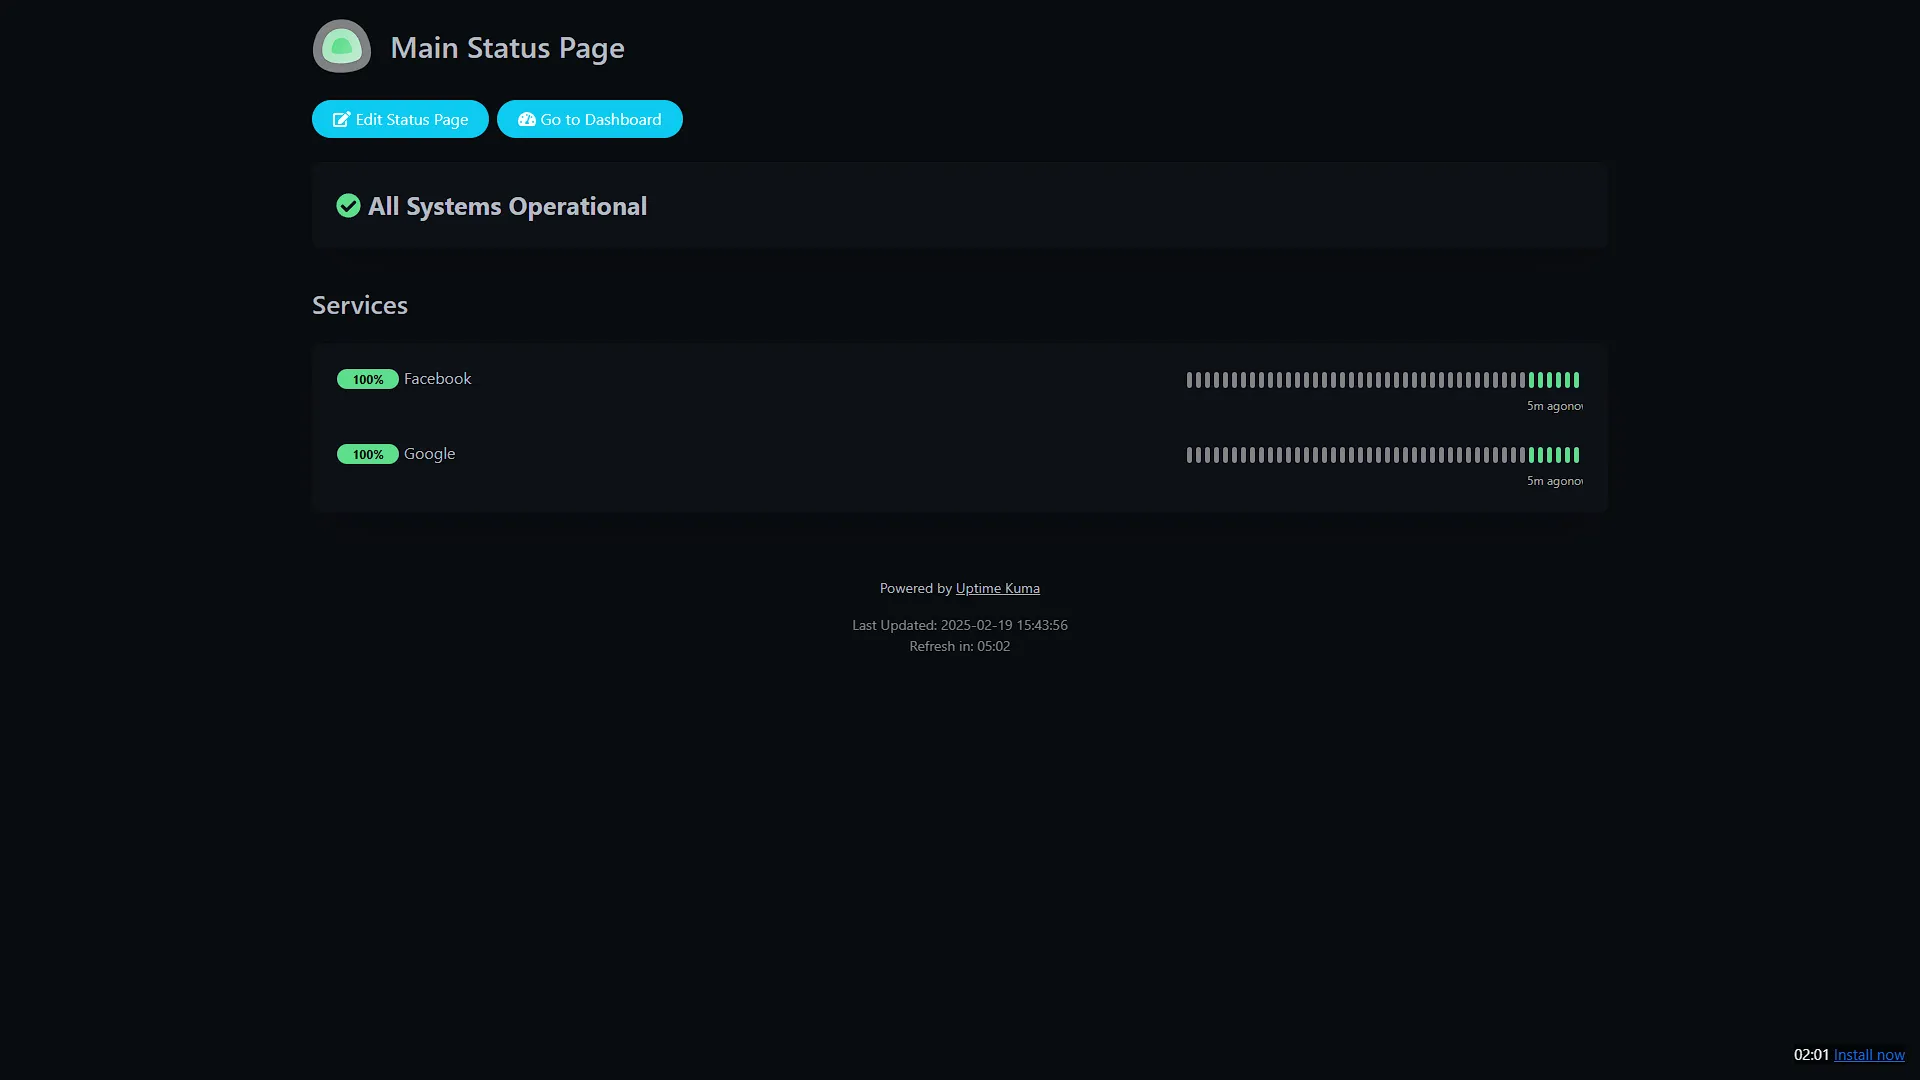
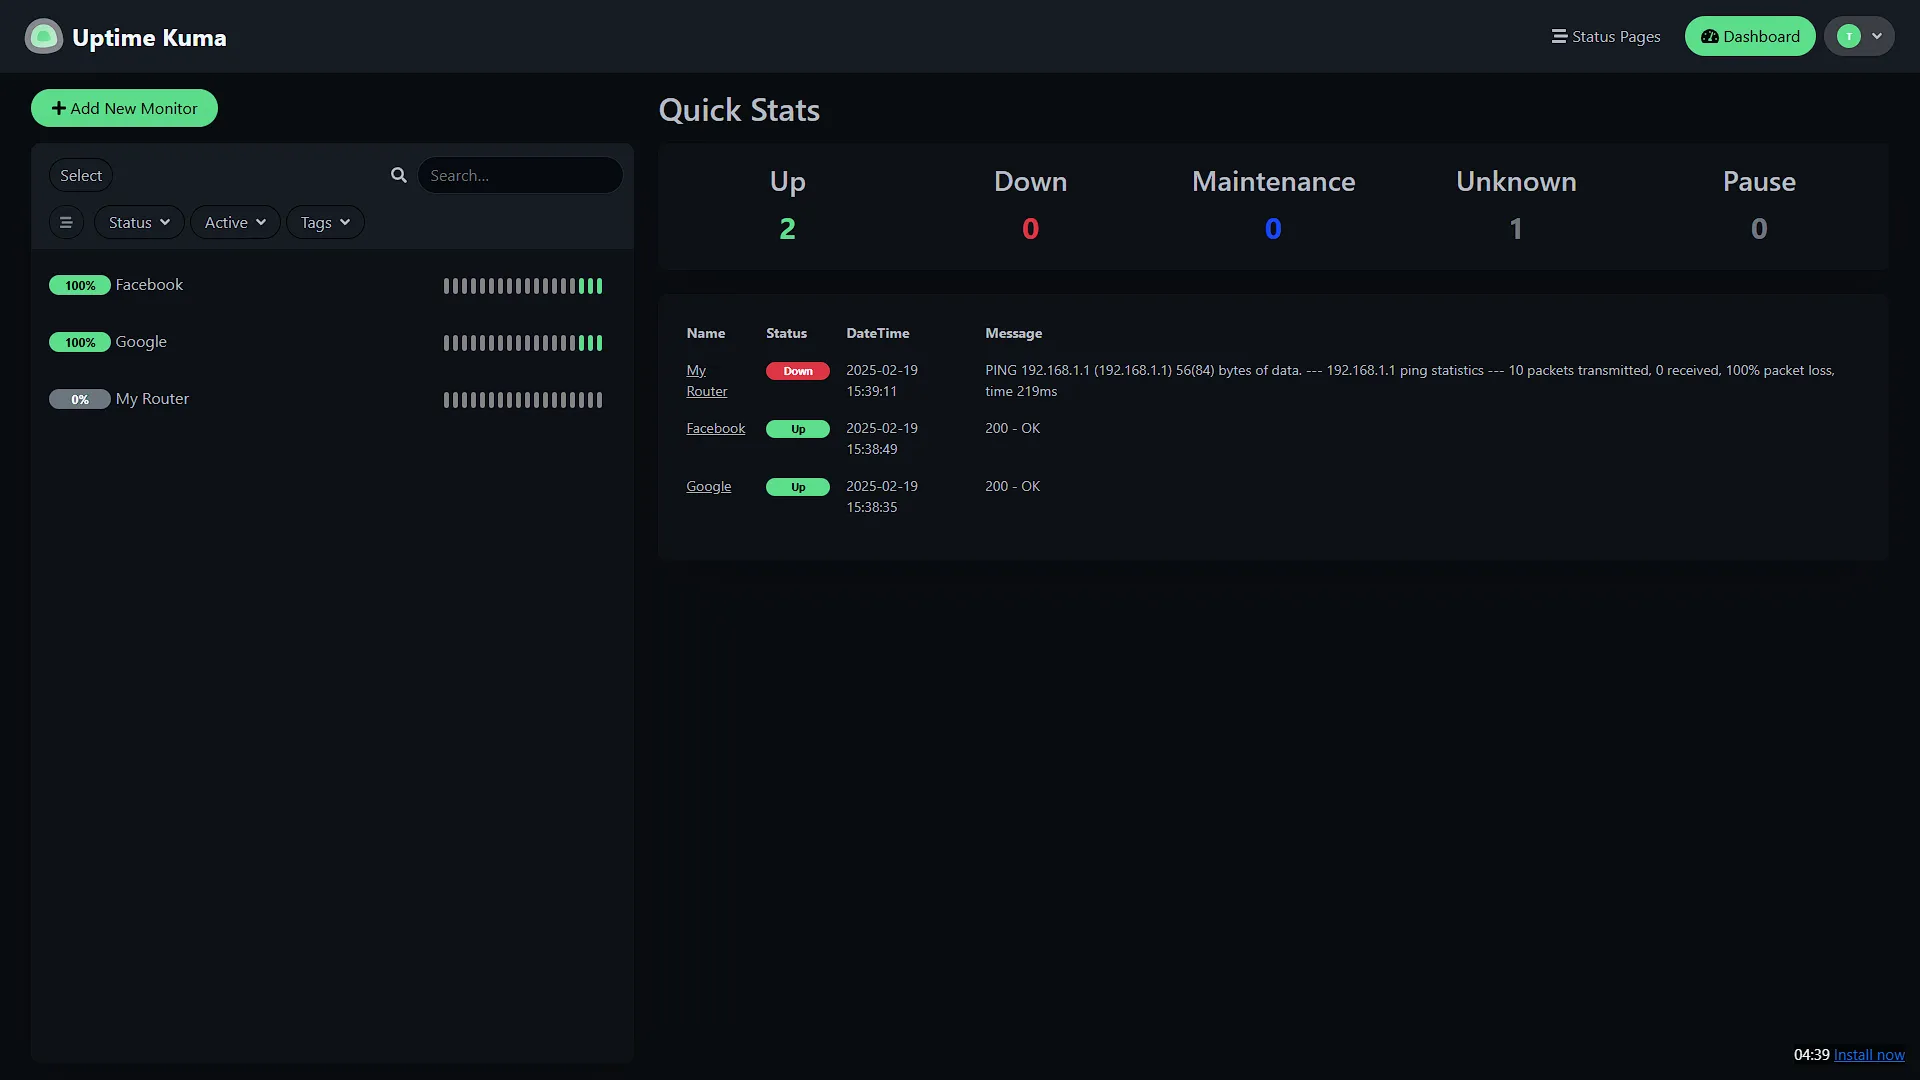
When a check fails according to its conditions and retry settings, Uptime Kuma can send an alert through a configured notification channel. Its user-friendly dashboard provides visual insights into the health and status of all your monitored services, making it easy even for non-technical users to understand what’s happening.
Choose a Check That Matches the Failure
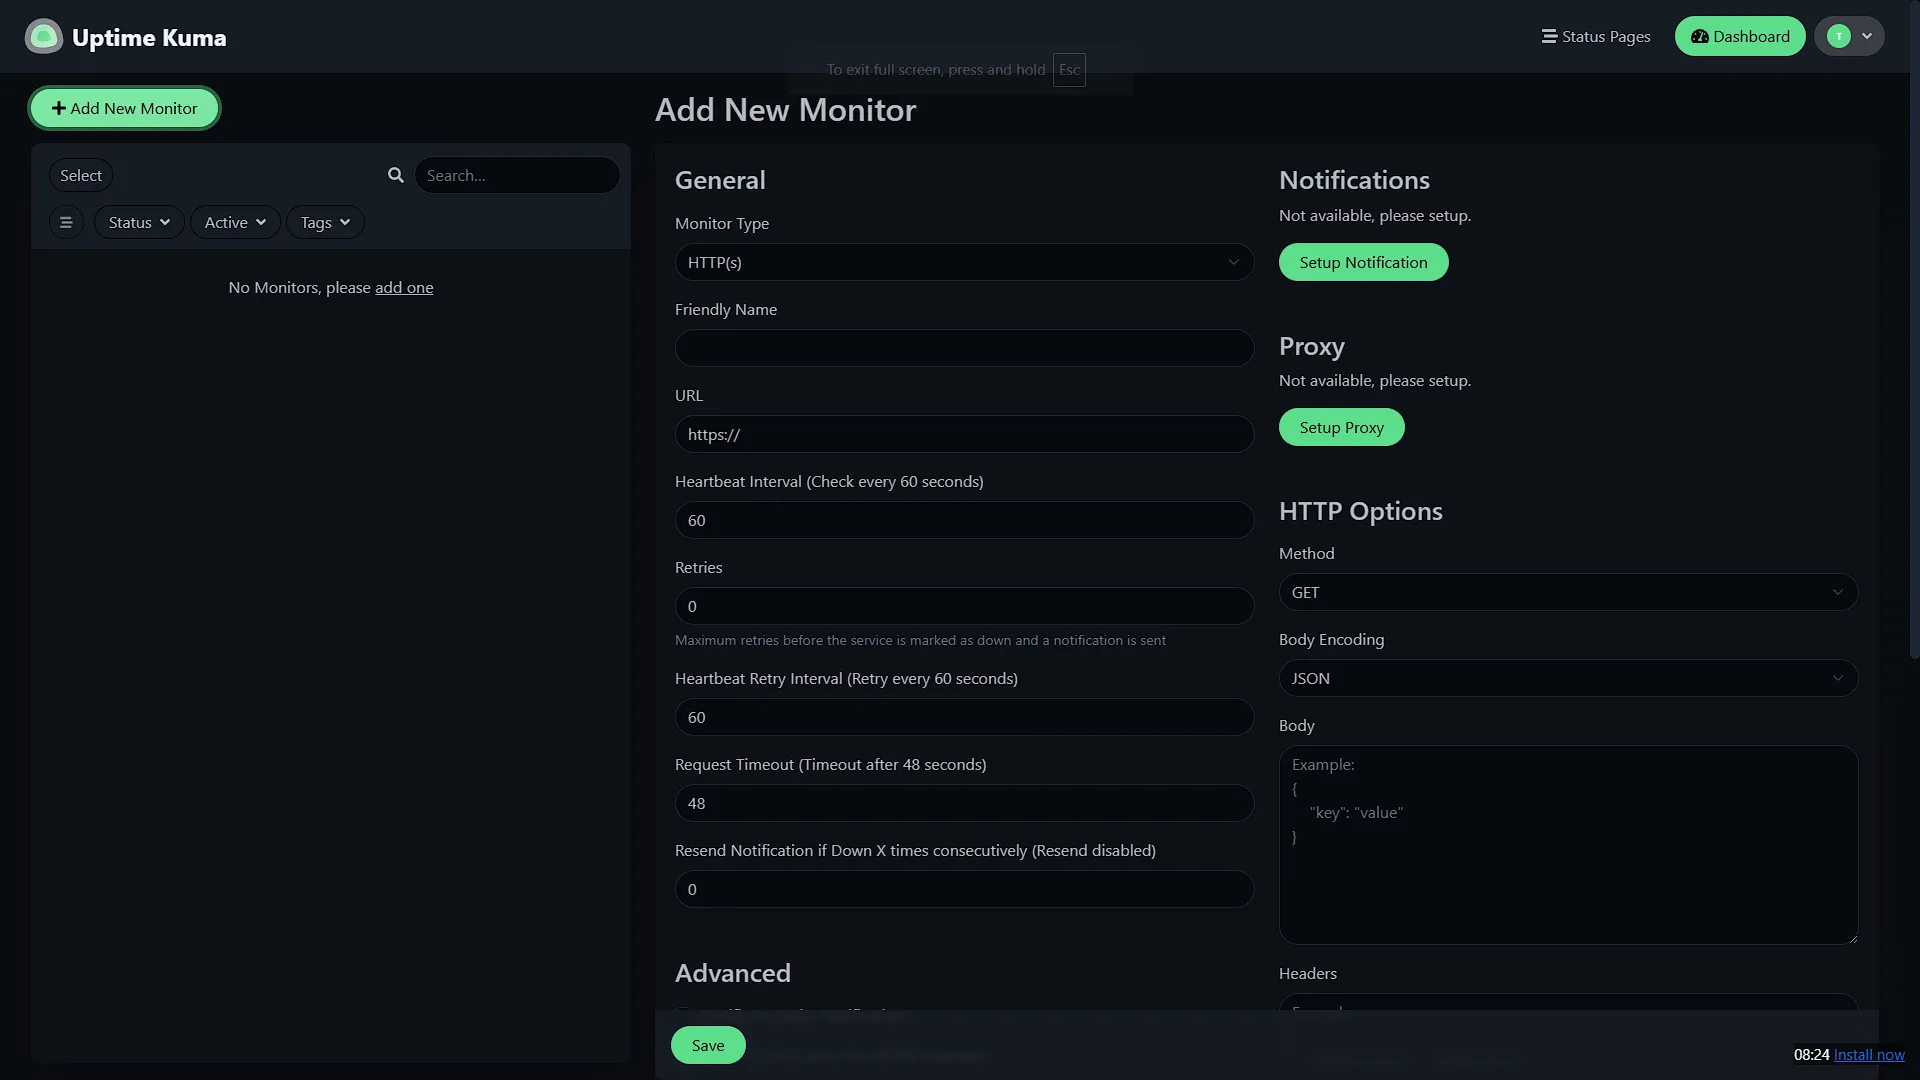
Uptime Kuma supports HTTP/S, keyword or JSON conditions, TCP, ping, DNS, push and Docker checks, among other monitor types. Choose the type for the question you want answered. A container running, a port accepting connections and an application serving useful content are different observations.
| Check | What success suggests | What it does not establish |
|---|---|---|
| Ping | The target responds to the configured network probe | Its website or storage service is healthy; some networks also block ping |
| TCP | A connection to the selected port can be established | The application completes a meaningful request |
| HTTP/S | The requested URL meets the selected response conditions | Every login, database query and user journey works |
| Keyword / JSON | The response includes the content or value you expect | A changing page cannot still contain a misleading success marker |
| Push | A job sent a heartbeat within the configured schedule | The job did useful work unless the heartbeat is conditional on verified success |
For a web application, a stable health endpoint is often more informative than the homepage. A login screen returning status 200 can remain reachable while the main application is broken. For database checks, use the options supported by the selected release and a suitable read-only account; avoid giving a monitoring credential unnecessary access.
Place the Monitor Where It Can Answer Your Question
A Kuma instance inside your homelab can check internal DNS, NAS and private services. It sees the network from that location. It does not independently prove that an outside user can reach a public site through the ISP, router, proxy and DNS path. An external check provides another perspective.
If the monitoring application shares the same power supply, server or Internet link as everything it checks, that shared failure can stop its alerts as well. Consider an independent notification or outside check for important services. The dashboard is a useful overview, but the monitoring system and delivery route also need to remain available.
How to Choose an Alternative
Uptime Robot and Pingdom are hosted options worth comparing when an outside viewpoint and managed operation matter. Nagios, Zabbix and a Prometheus-based setup address broader monitoring workflows. Compare required check types, configuration effort, alert routing, history and operating costs for your actual workload.
For me, Uptime Kuma's attraction is its straightforward interface and self-hosting. A tool collecting CPU, memory and disk metrics answers different questions from an endpoint-availability check. You can combine them instead of forcing one tool to do every job. Fixed RAM figures without a monitor count and workload are not a useful basis for choosing.
A Local Docker Starter
Docker remains my preferred easier installation route. Install it from the official Docker website using the instructions for your host, then check docker compose version. Use an image supported on the host's architecture and keep persistent data on local storage. The project warns against NFS for its data directory because database locking matters.
For a new installation, this starter follows the current documented louislam/uptime-kuma:2 major-version image and /app/data volume. The major tag receives new releases; record the installed version, or pin a supported full release tag for deliberate updates. Save as compose.yml in a dedicated directory:
services:
  uptime-kuma:
    image: louislam/uptime-kuma:2
    restart: unless-stopped
    ports:
      - "127.0.0.1:3001:3001"
    volumes:
      - uptime-kuma-data:/app/data
volumes:
  uptime-kuma-data:
docker compose config --quiet
docker compose up -d
docker compose ps
docker compose logs --tail=80 uptime-kumaOpen http://localhost:3001/ on the Docker host and complete account setup. Add one monitor you understand, configure a notification provider and use its test function. Then briefly stop a disposable service you control to verify the expected down and recovery notifications. Do not interrupt an important shared service merely to test an alert.
The loopback port limits this starter to the host itself. For access from other devices, deliberately configure the LAN or an authenticated HTTPS proxy. Uptime Kuma uses WebSockets, so the reverse proxy must support the required upgrade path. A proxy in another container needs a suitable shared network rather than assuming its own localhost reaches this host port.
Native Installation
The Uptime Kuma GitHub page also documents native installation. Use the supported Node.js version from the official website and the selected release's setup instructions. The current guide uses npm run setup, followed by the documented server command and a process manager for ongoing operation. A dependency install alone does not perform every application setup step. Back up the data and review upgrade requirements regardless of installation method.
Alerts, Scheduled Jobs and Status Pages
Notifications: Attach the selected provider to the intended monitors, test delivery and check the expected failure/retry timing. Choose an interval appropriate to the service and a retry policy that limits noise without hiding a meaningful outage. Alerts are based on checks and delivery latency, not instantaneous knowledge of every failure.
HTTPS certificates: Enable the relevant expiry notification and set suitable thresholds in the installed release. Keep normal certificate validation enabled for public sites. An expiry warning does not repair renewal or prove that every proxy endpoint uses the same certificate; check the actual URL monitored.
Push monitors: For a scheduled backup, create a push monitor with an interval that covers the schedule, normal run duration and a reasonable grace period. Use the generated success URL only after the backup command and necessary checks succeed. Sending success unconditionally at the end of a script can hide a failed backup.
Store the generated URL privately in KUMA_PUSH_URL. This example only sends that heartbeat; it does not run or validate a backup:
curl --fail --silent --show-error --max-time 10 --retry 2 "${KUMA_PUSH_URL:?Set the private generated success push URL}"Quoting the full URL keeps query-string characters from being interpreted by the shell. Protect the token because anyone possessing it may submit a heartbeat. A notification that a backup completed is still different from a successful restore test.
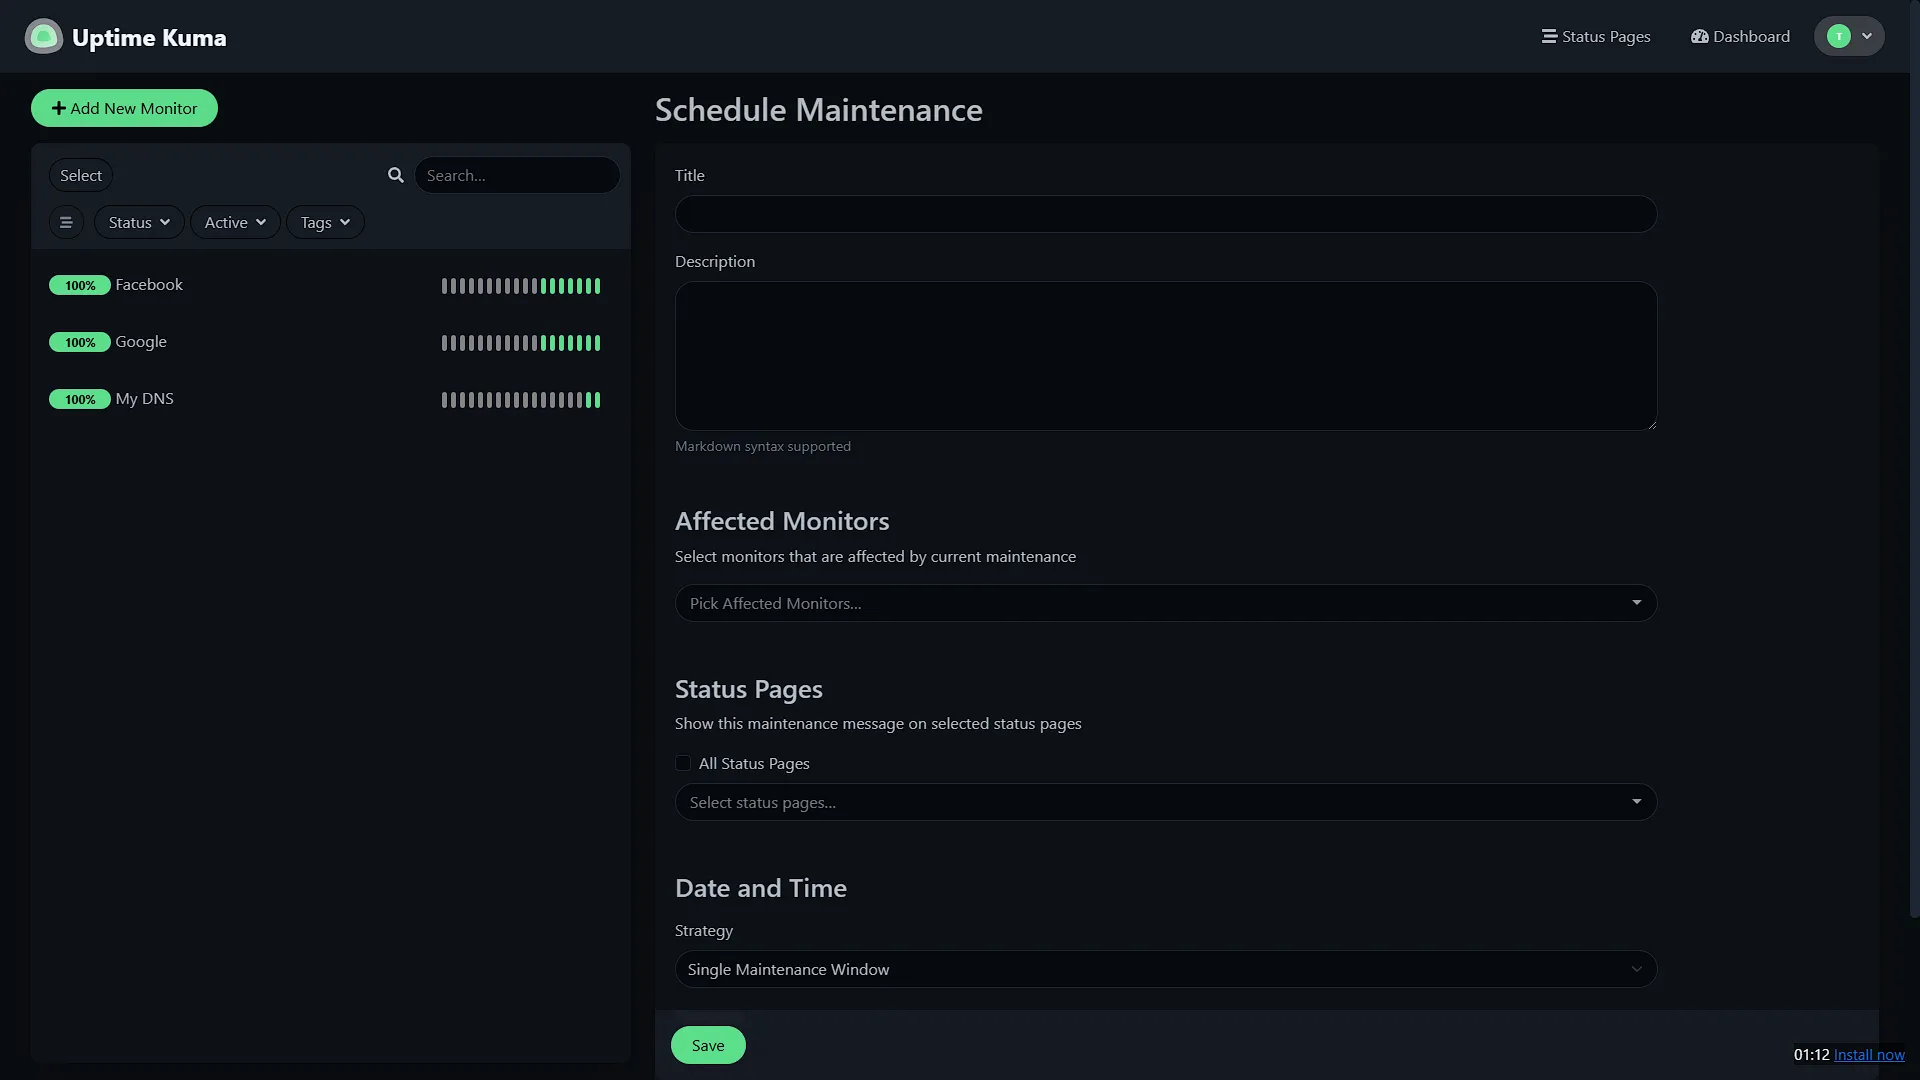
Status pages and maintenance: Publish only the service names and details the intended audience needs. Review a public page from a logged-out browser and avoid exposing private addresses or sensitive incident descriptions. Scheduled maintenance helps explain planned work and manage alert noise; it should not hide an ongoing fault after the maintenance window.
Docker Monitoring Needs Deliberate Access
Native container-state monitoring requires access to the Docker daemon. The project's documentation warns that exposing its socket or API gives Kuma powerful host control. A bind mount marked :ro does not turn Docker API commands into read-only operations. Do not add the socket merely because it appears in an example.
Often an HTTP, TCP or push check answers the service-health question without daemon access. If container-state monitoring is required, follow the official setup and restrict access to Kuma and the daemon. Do not expose an unauthenticated Docker TCP listener. A running container alone does not prove that its application or background job is healthy.
Backups and Version 2 Migration
Uptime Kuma's v1-to-v2 guide requires stopping the application and backing up the complete data directory before migration. It removes the older JSON backup/restore feature and warns not to interrupt the database migration. Rootless images are not recommended for that initial upgrade. Read the guide before changing an existing v1 deployment to this article's v2 image.
Retain the actual data volume and a separate recoverable backup. A Compose file does not contain monitor history, users and notification settings by itself. Keep backups private because configuration may include provider secrets. Test restoration separately and verify monitors, history and notification delivery after an update.
Conclusion
Uptime Kuma is an accessible, flexible choice for watching homelab services, and its dashboard remains a strong reason to try it. Give each monitor a clear purpose, verify the alerts and protect its data and access. A small dependable set of checks is more valuable than a large dashboard whose green indicators are difficult to interpret.
See the installation guide, v2 migration guide and Docker-monitoring guidance.