Now that we have our homelab hardware sorted and Proxmox installed, it is not a bad idea to keep an eye on CPU temperature seeing as we will probably (hopefully) keep the machine powered on 24/7. And if we can put our thermal monitoring on a place that we see often, we will also be able to start gauging which virtual machines and which containers are causing thermals to rise. This way we can manage our home lab main node a lot easier. Yes, we can set up automated notifications when our thermals hit a specific state, but that is out of the scope for today - today we are going to set everything up and get it displayed on the main node summary page. Let's get cracking.
Step 1 - Getting the package installed
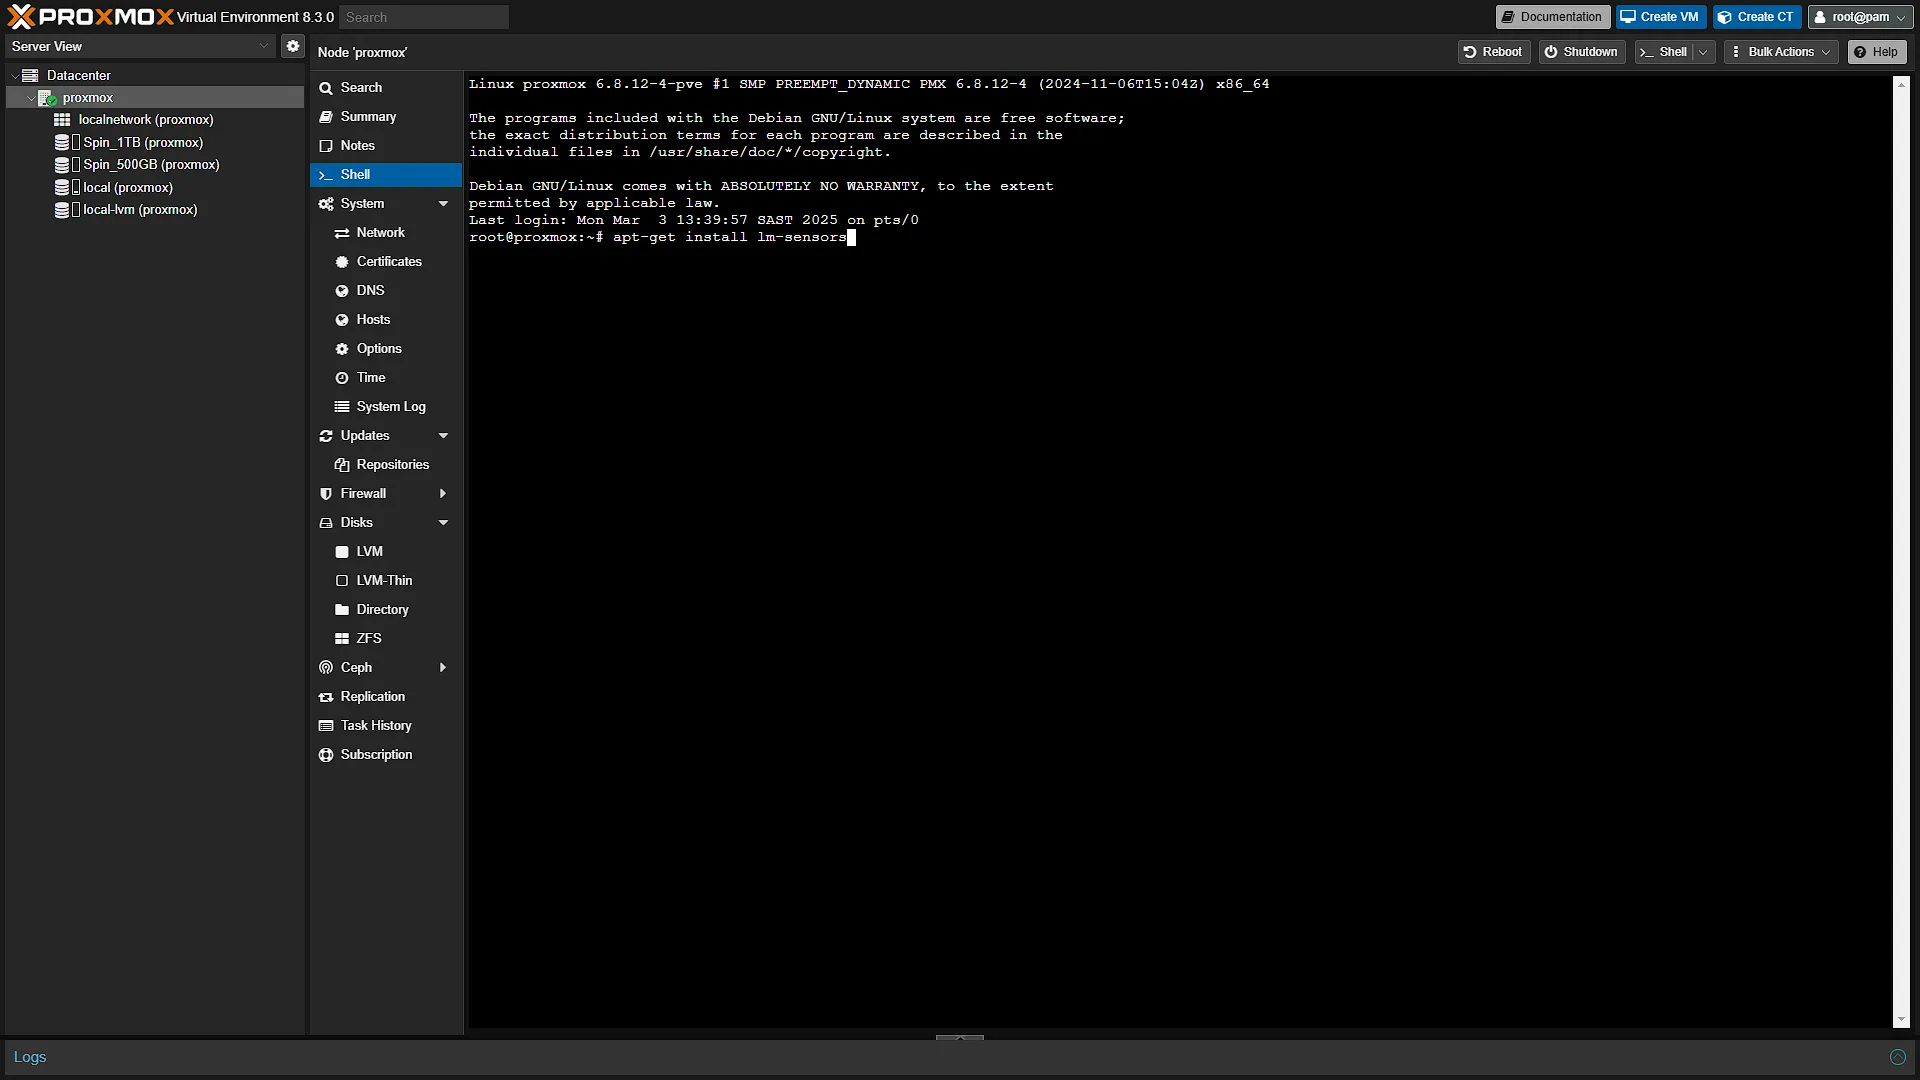
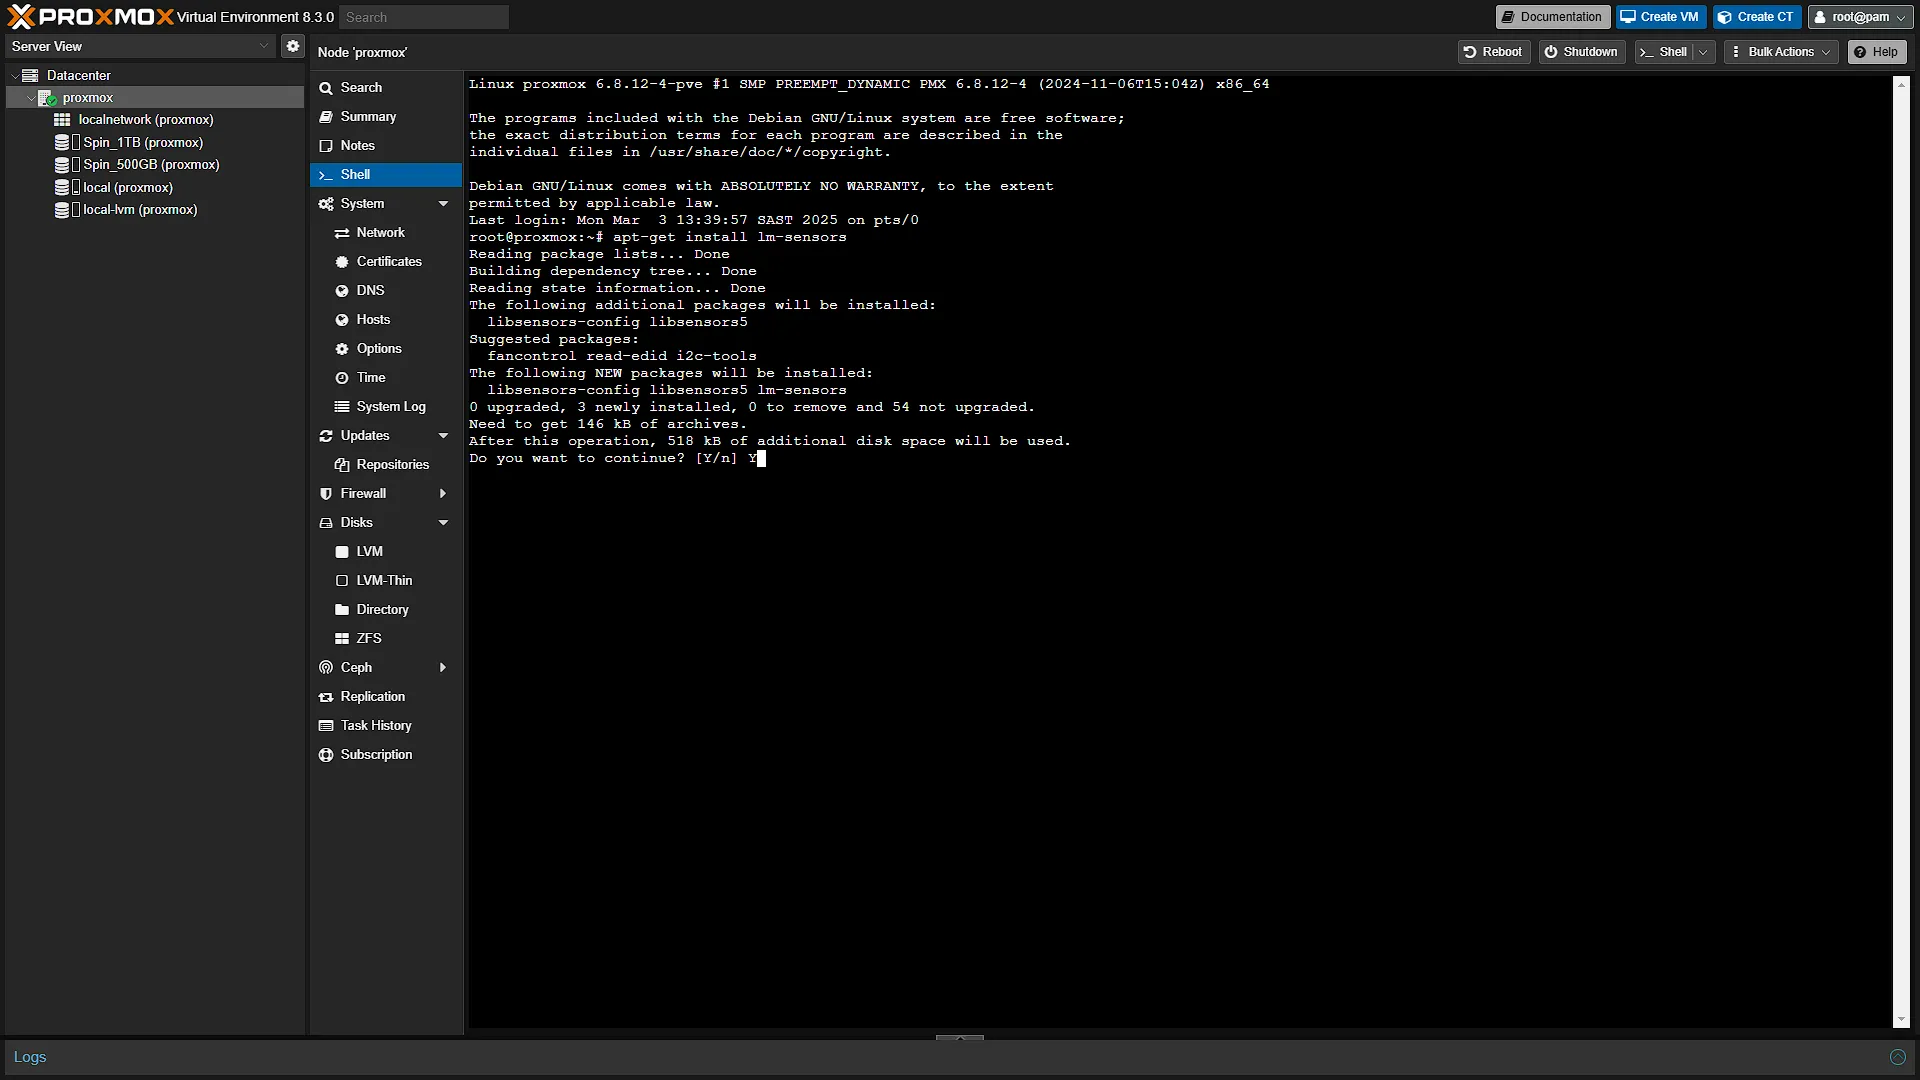
For us to be able to read the current thermal state, we need to first get a Linux package, called sensors, installed on the Proxmox main node. To do that, we will first need to access our Proxmox machine again, on the URL we set up in the previous article when we installed Proxmox, so navigate to https://<your-proxmox-ip>:8006 (for example, https://192.168.1.2:8006). Log in and expand the Datacenter node in the left pane. Select the Proxmox server node. In the middle action pane, select Shell. This will open an integrated shell terminal window you can use to run commands on your Proxmox node. Run the following command:
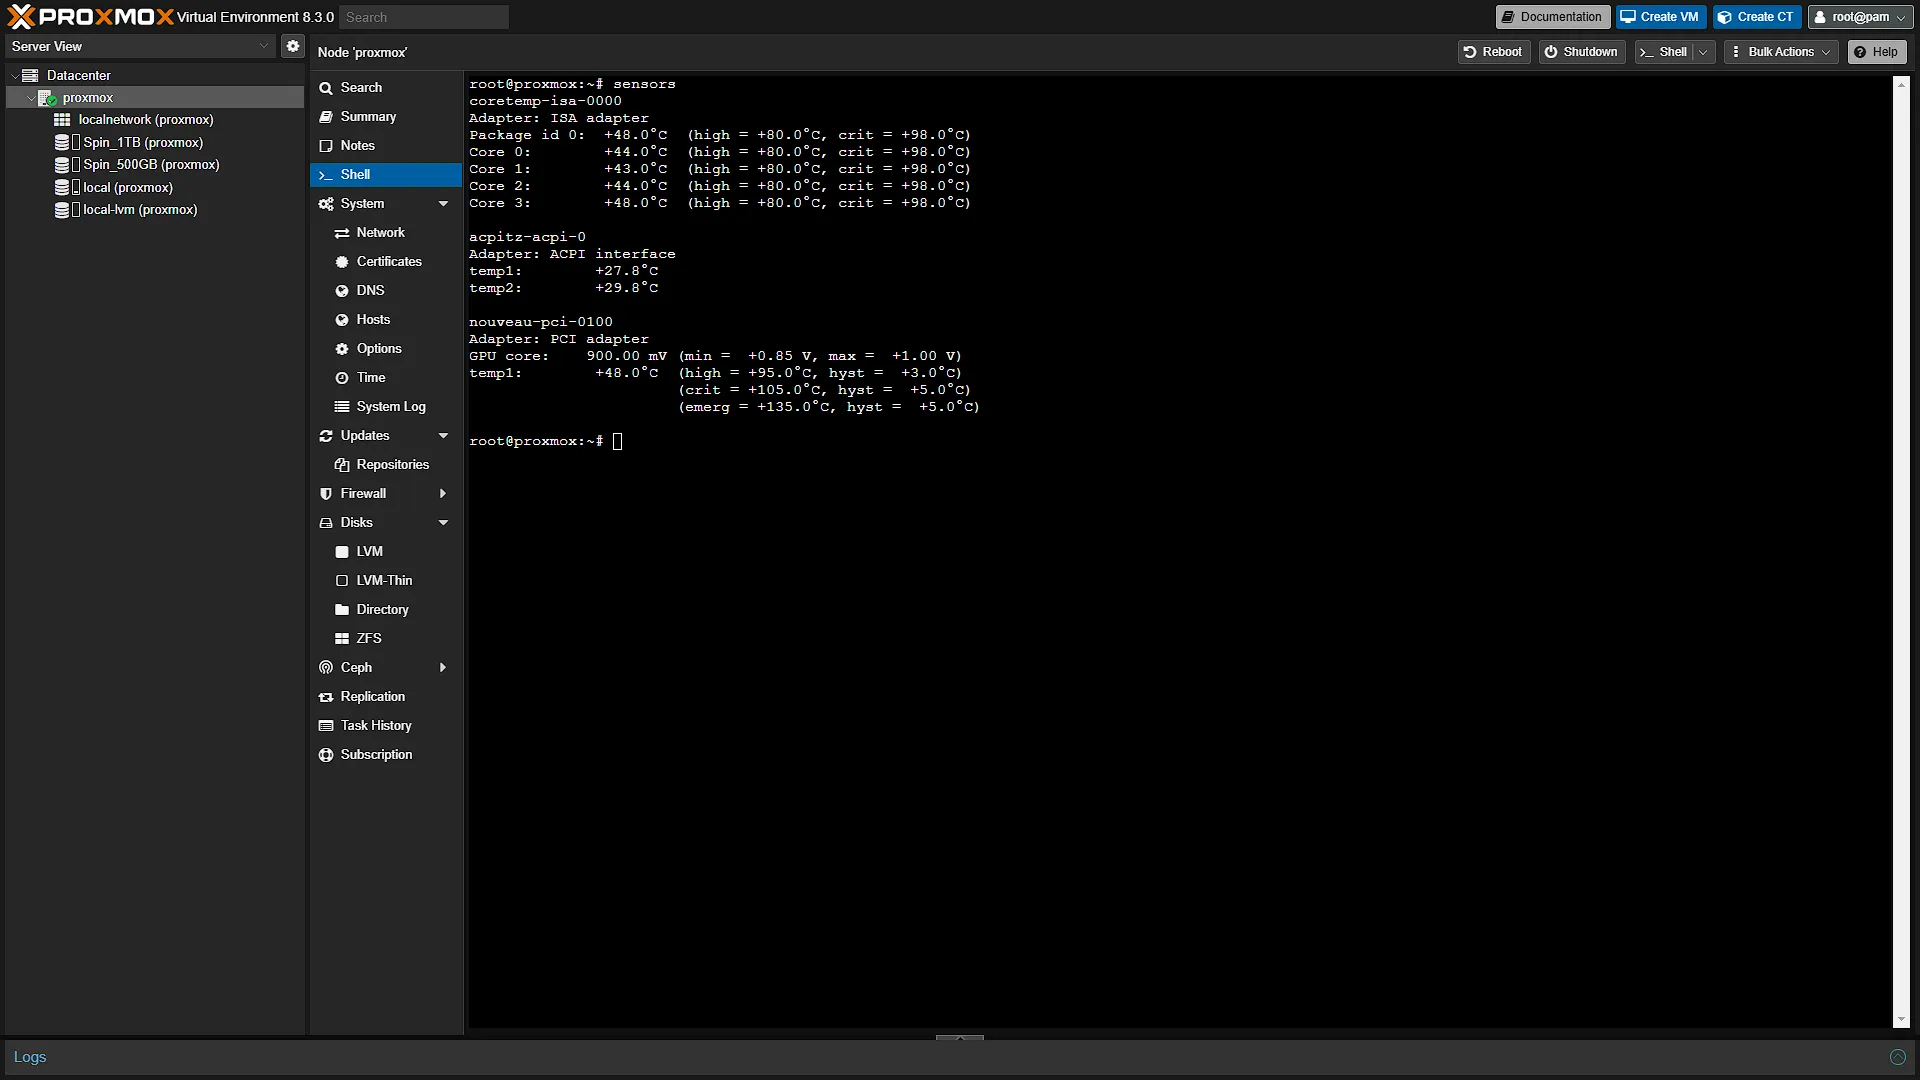
apt-get install lm-sensorsFollow the on screen prompts and make sure it installs correctly. To test, just run the command sensors and you should see an output of all the temps for each of your CPU cores. (see screenshot below)
Step 2 - Set up Proxmox Main Files
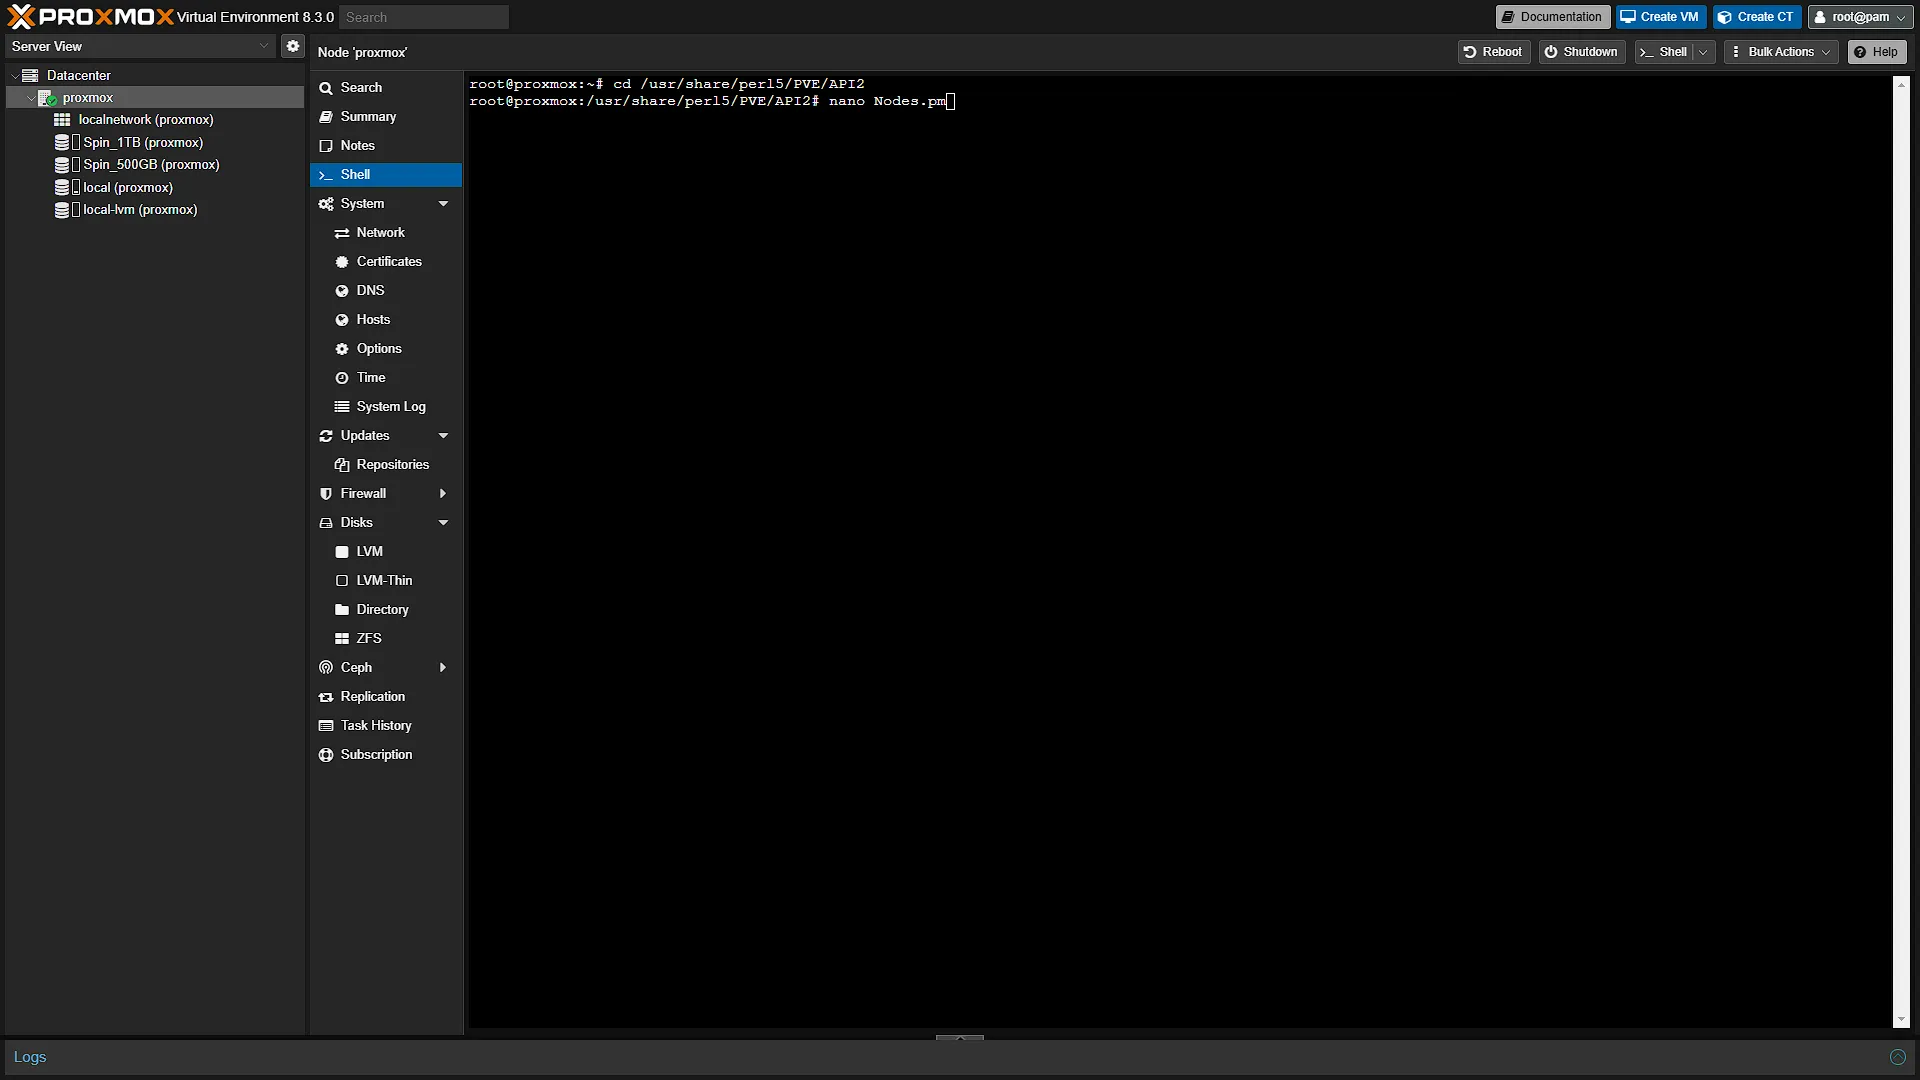
Now we need to expose the thermal command to the Proxmox system in such a way that Proxmox knows we need to run sensors command and whatever we get back needs to be usable. We do this by creating a new probe with a global variable name so we can use it. We do this by going into a directory and editing the Perl API file Nodes.pm. Run the following commands:
cd /usr/share/perl5/PVE/API2
nano Nodes.pm
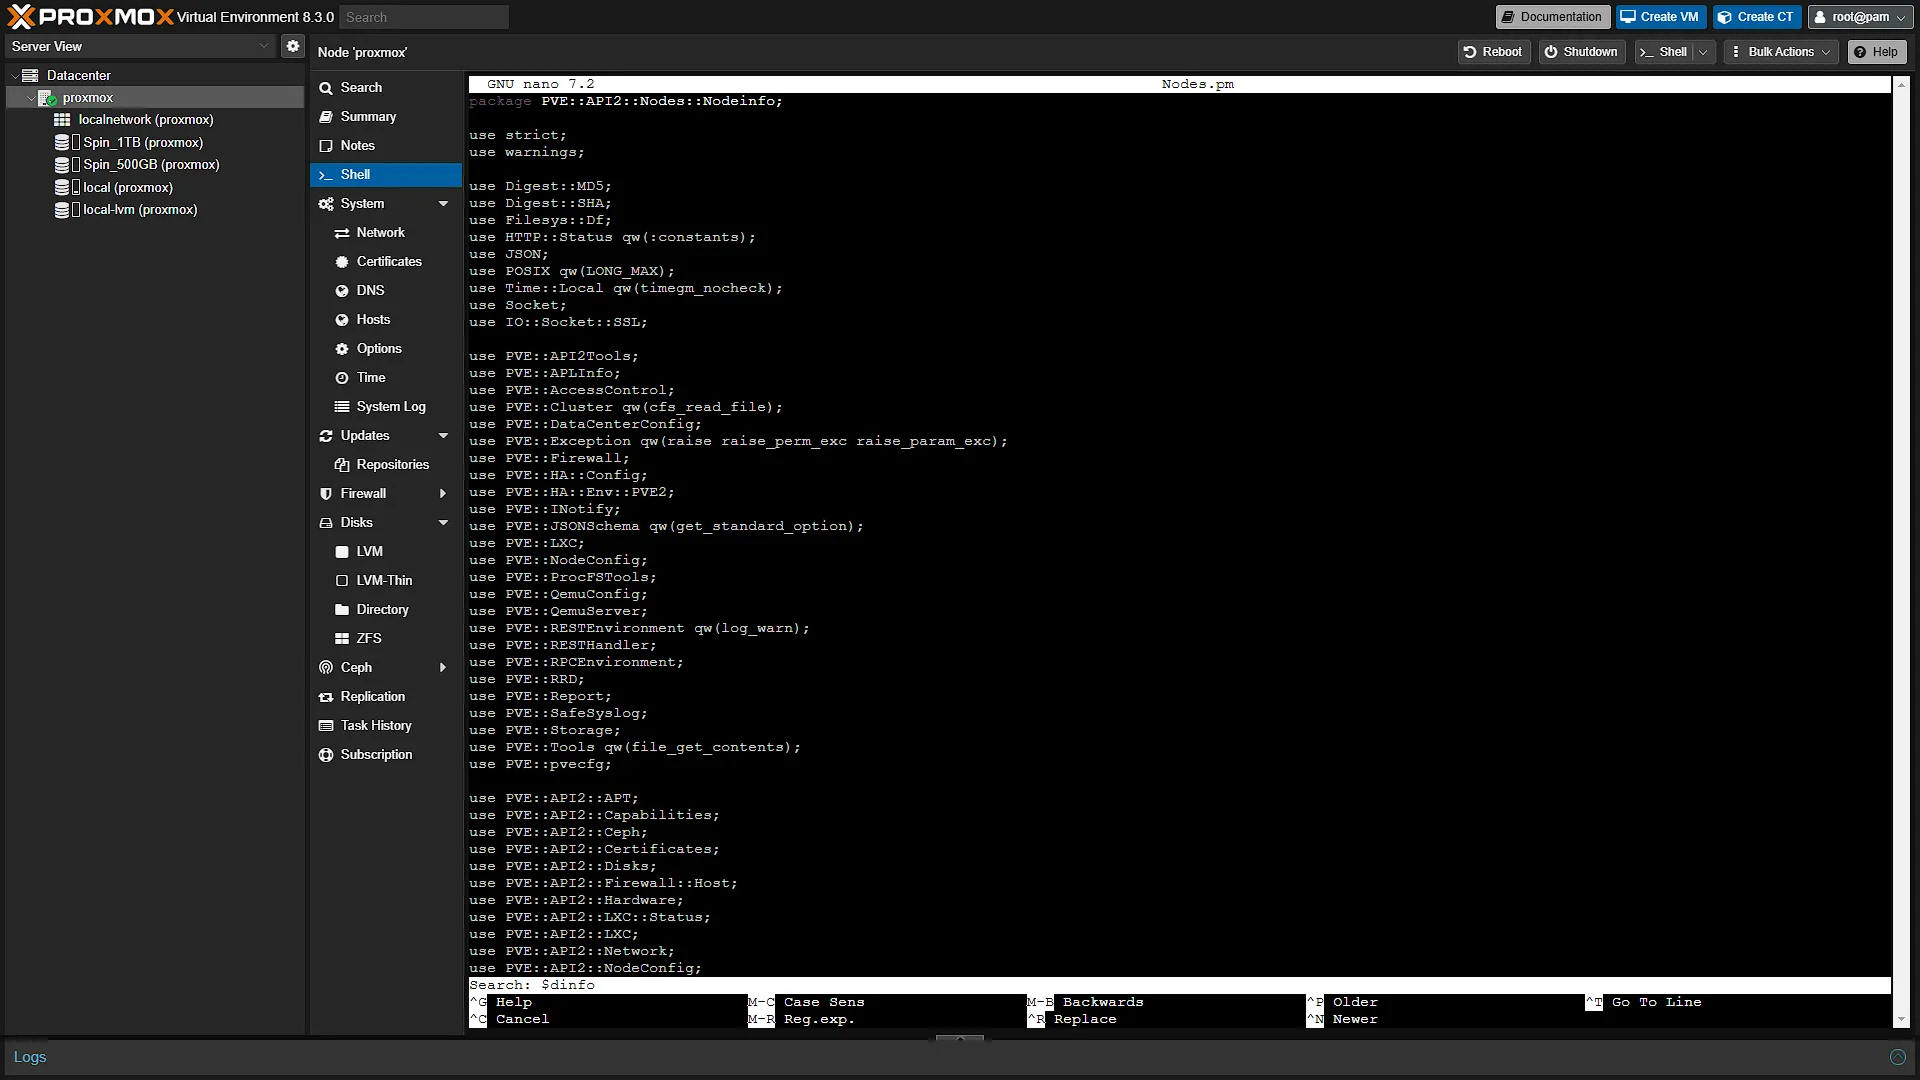
This will open the configuration file that we need to edit. We need to add specific code, but first we need to find the place where we need to add it. Press F6 (this is a search command). In the bottom of the screen, you will see the search bar open. Type $dinfo and press Enter to search. We need to add the following line just above the search result line:
$res->{thermalstate} = `sensors`;Please note, the character is not the normal single quote (') but rather the backtick (`) character. In Perl, backticks execute sensors and capture its output; ordinary single quotes would produce the literal word instead of the sensor readings. See below screenshot as to how the file should look:
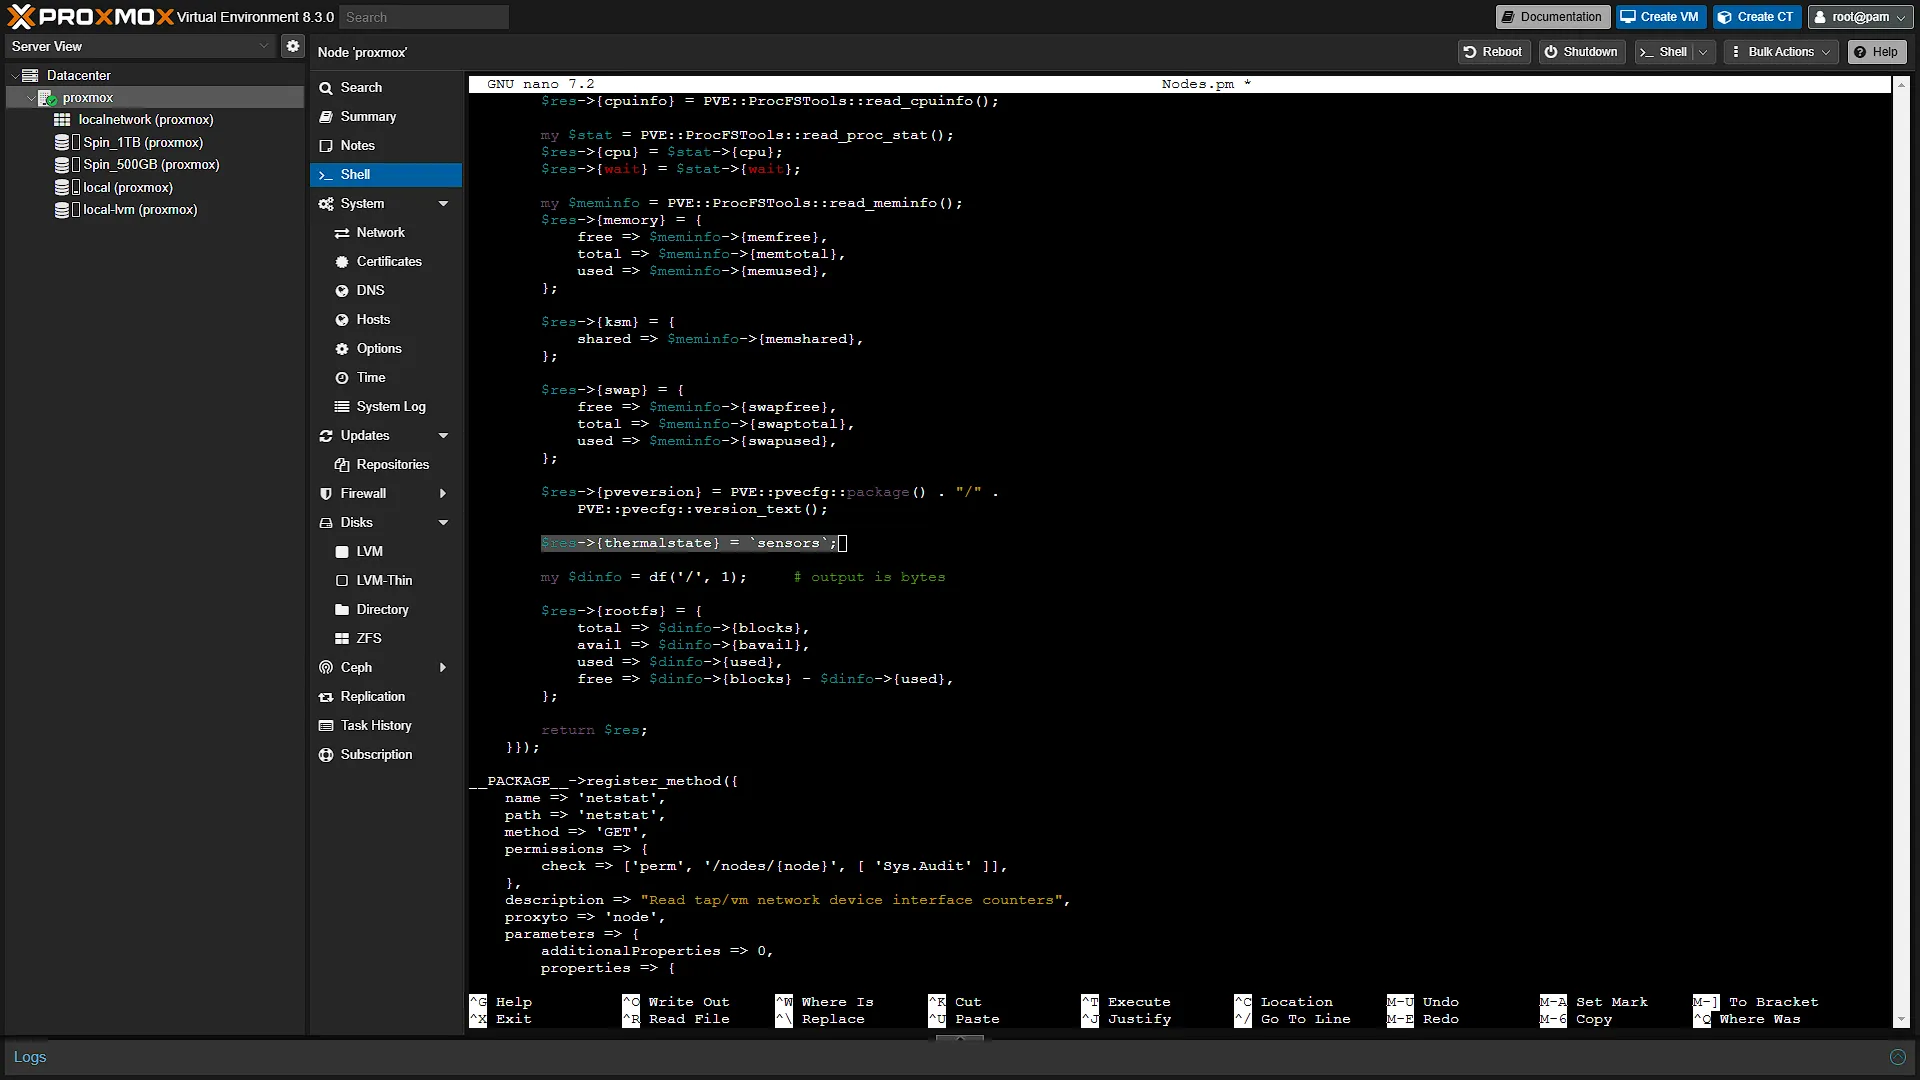
To save the changes, press Ctrl+S, and to exit, press Ctrl+X. When in doubt, check the shortcut keys at the bottom of the window for reference. You should now be back in the original terminal window where we can run more commands. Don't navigate away yet as we still have one more thing to do before we can enjoy the thermal information.
Step 3 - Add a display to the main summary screen
Now that we have a new variable, called thermalstate that contains the output of running the sensors command, we can add this information to our main home screen for the node. For this we need to edit the Summary layout page template. So again we need to navigate to a directory where this config file is, and then edit the relevant file. Run the following two commands:
cd /usr/share/pve-manager/js/
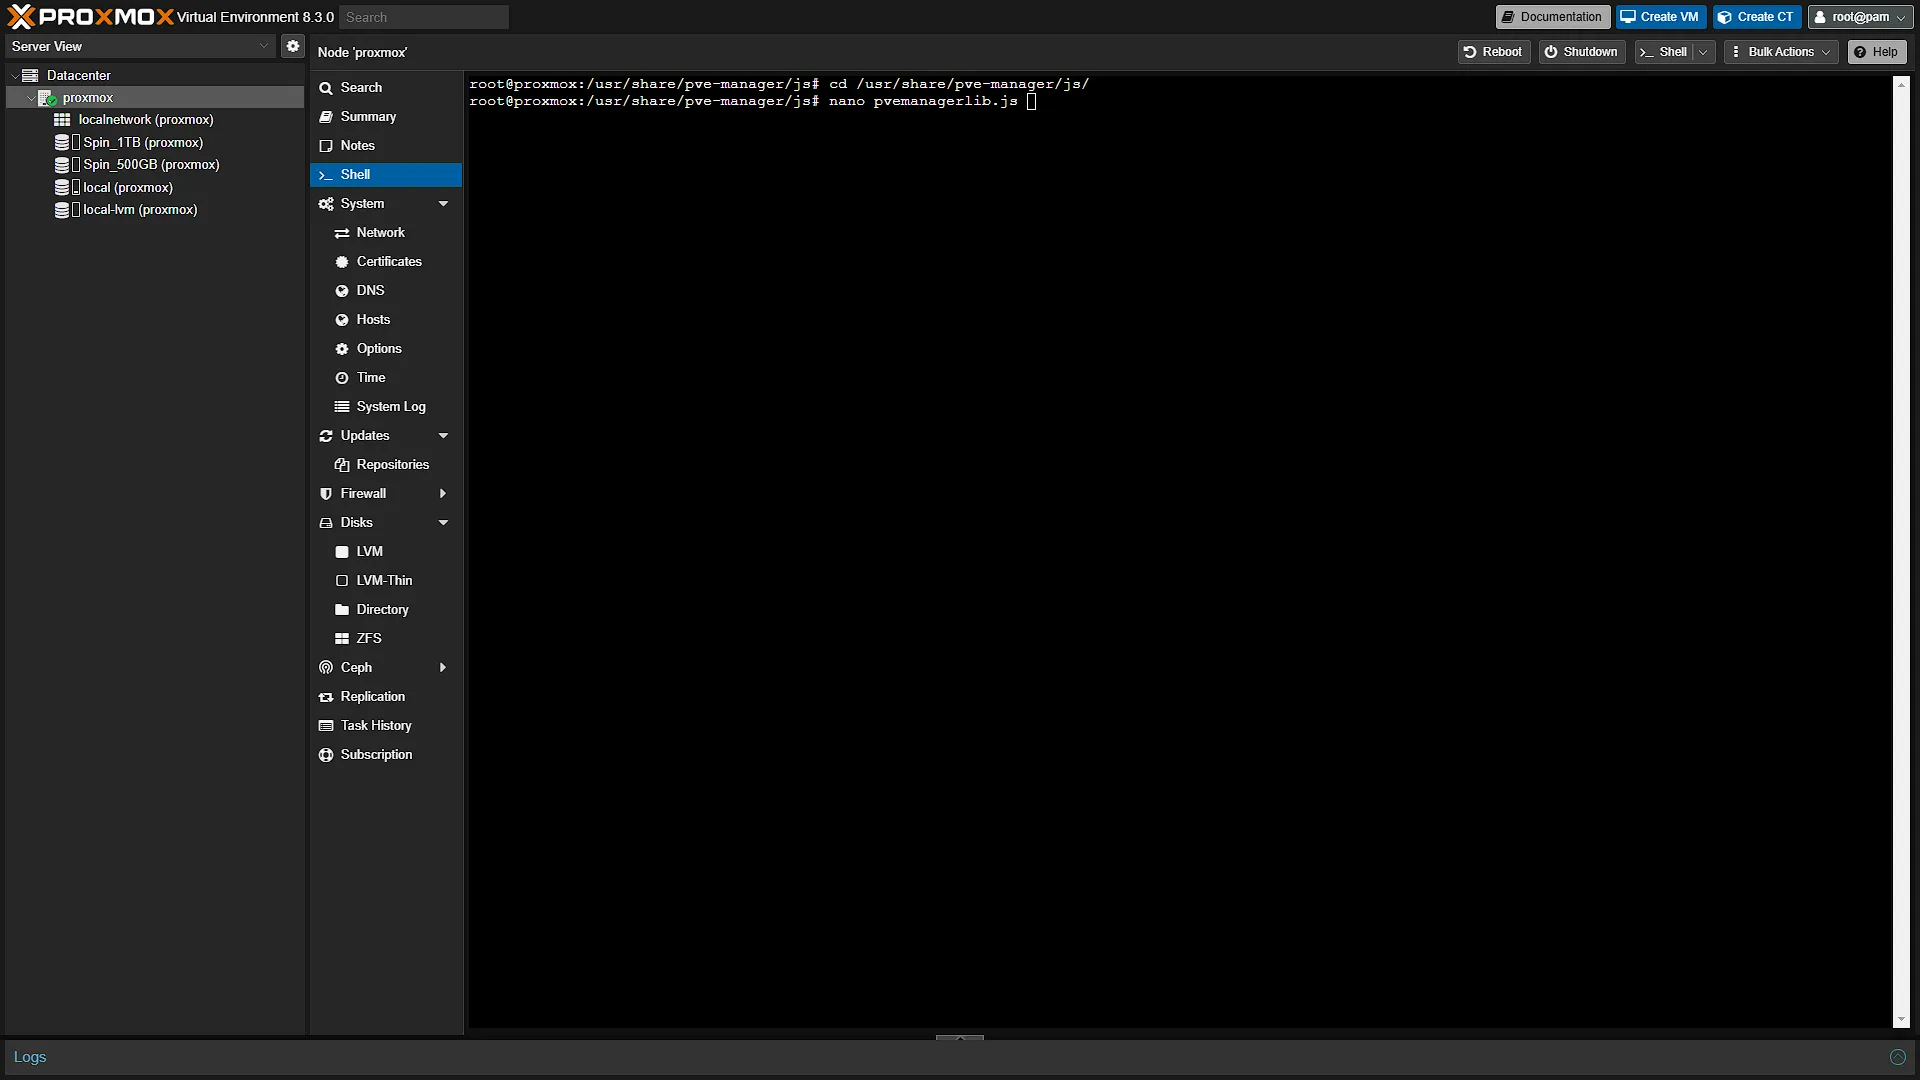
nano pvemanagerlib.js
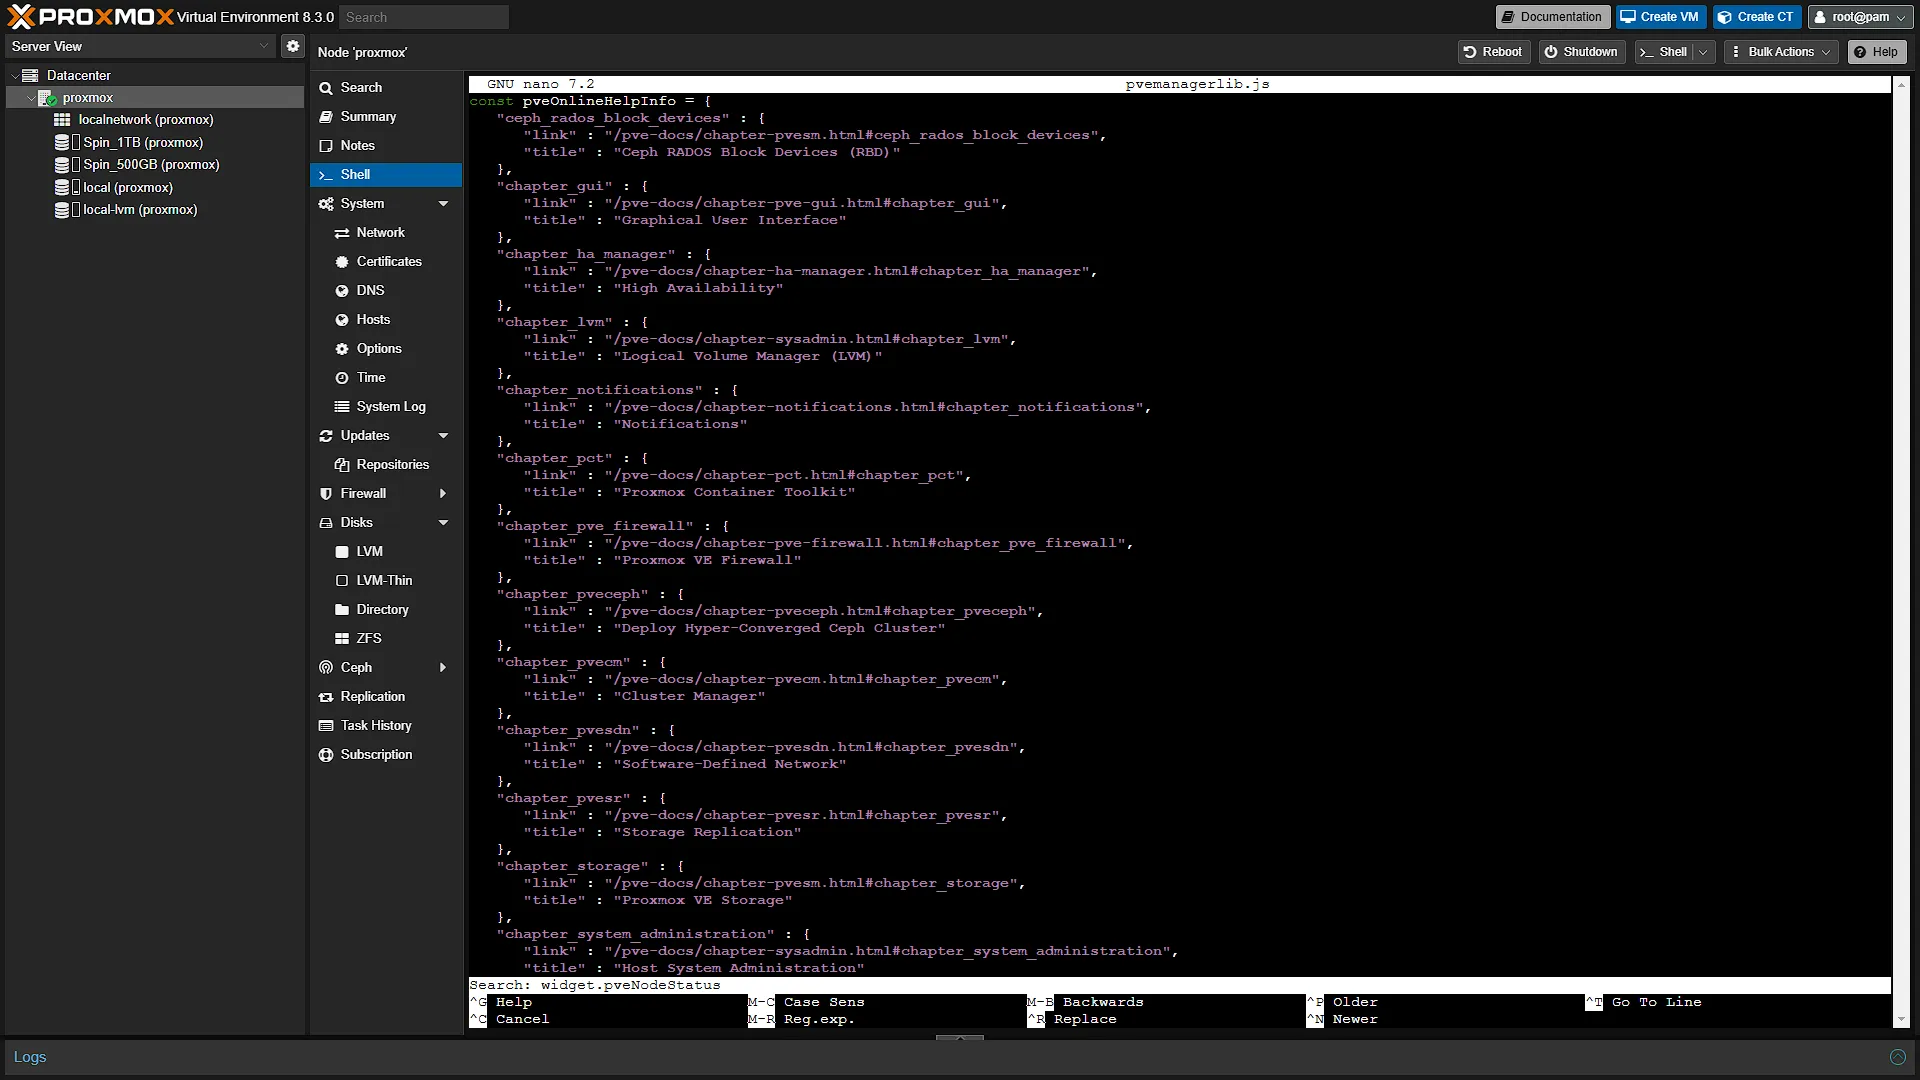
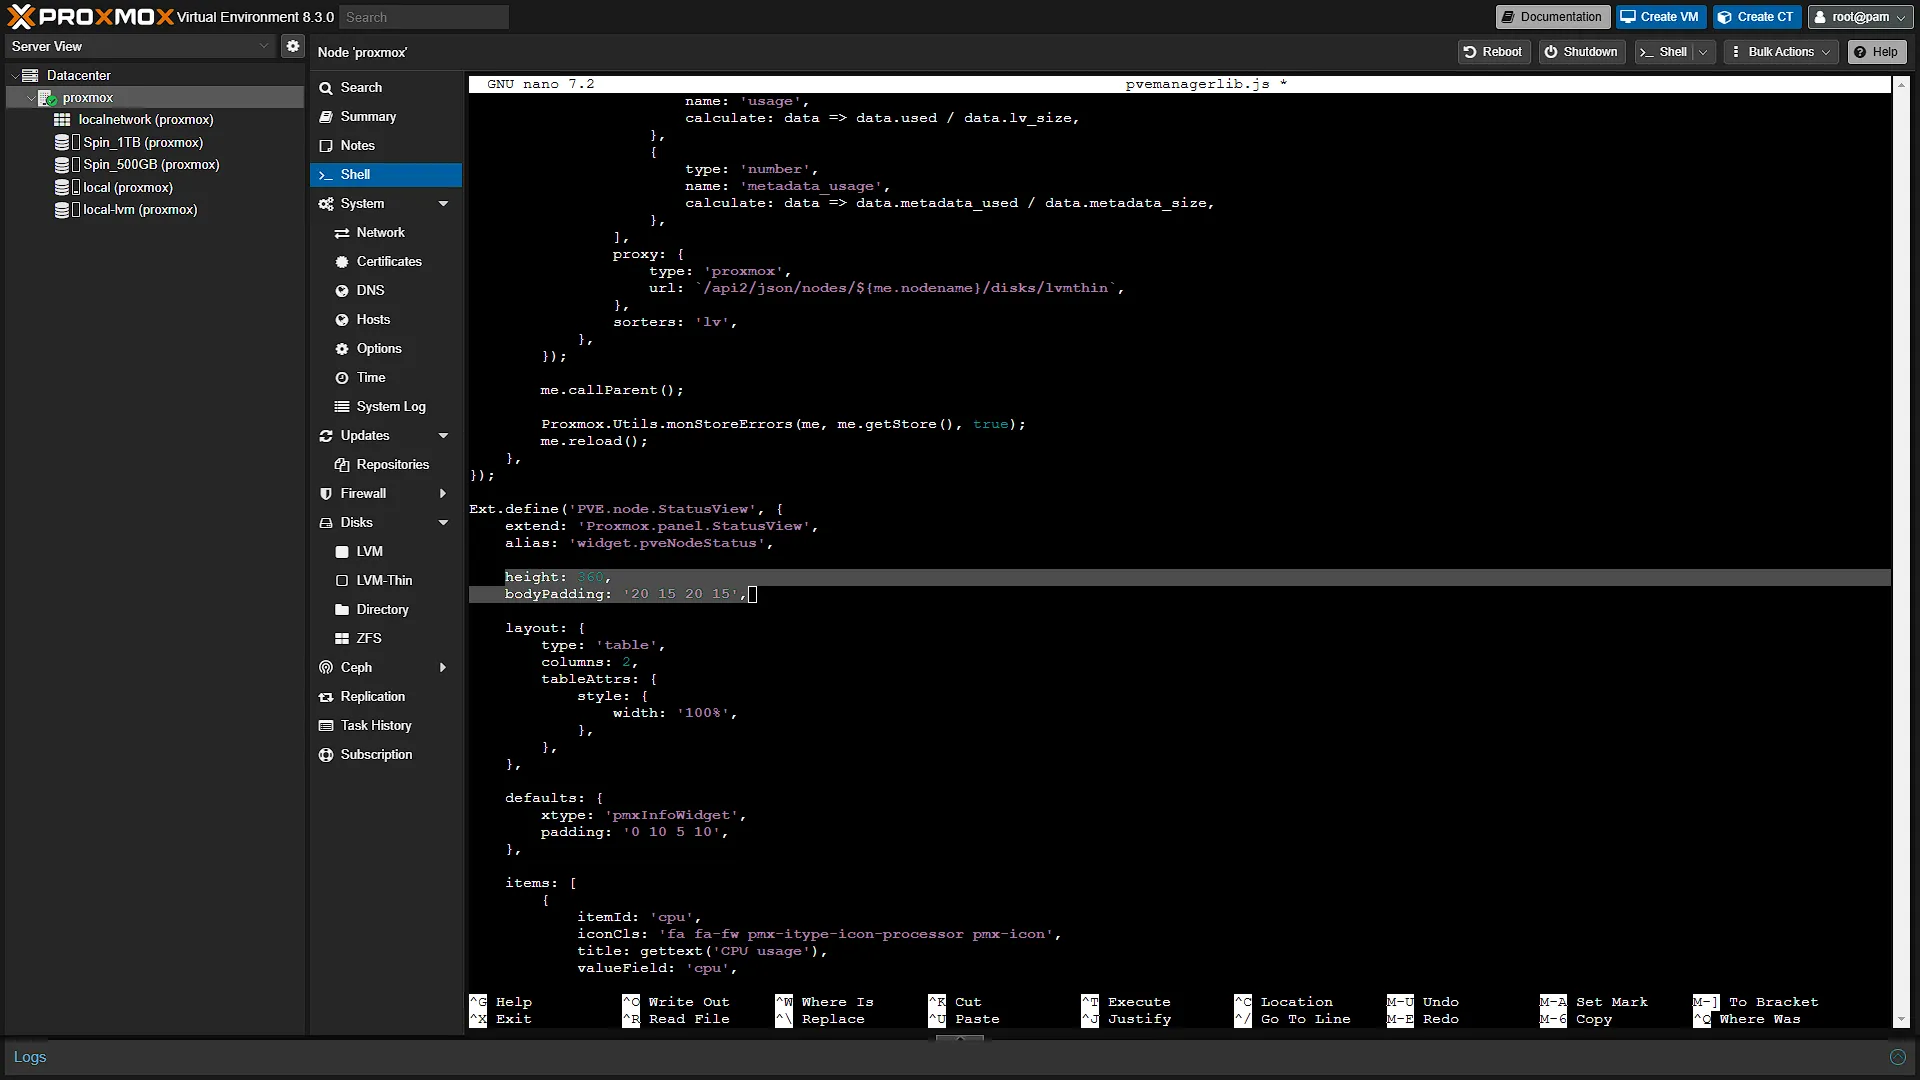
Firstly we need to give ourselves some space to add the information, so press F6 and search for widget.pveNodeStatus . We need to change the height to 360 and the bodyPadding to 20 15 20 15. See screenshot below:
Don't close yet, we again need to get to a specific part of the document, so press F6 again and search for itemId: 'version' (note that those are normal single quotes, we are searching for the item with the literal name version). This will bring us to a section of code, where we need to add our code before. This is what you will get:
//INSERT OUR NEW CODE HERE
{
       itemId: 'version',
       colspan: 2,
       printBar: false,
       title: gettext('Manager Version'),
       textField: 'pveversion',
       value: '',
},
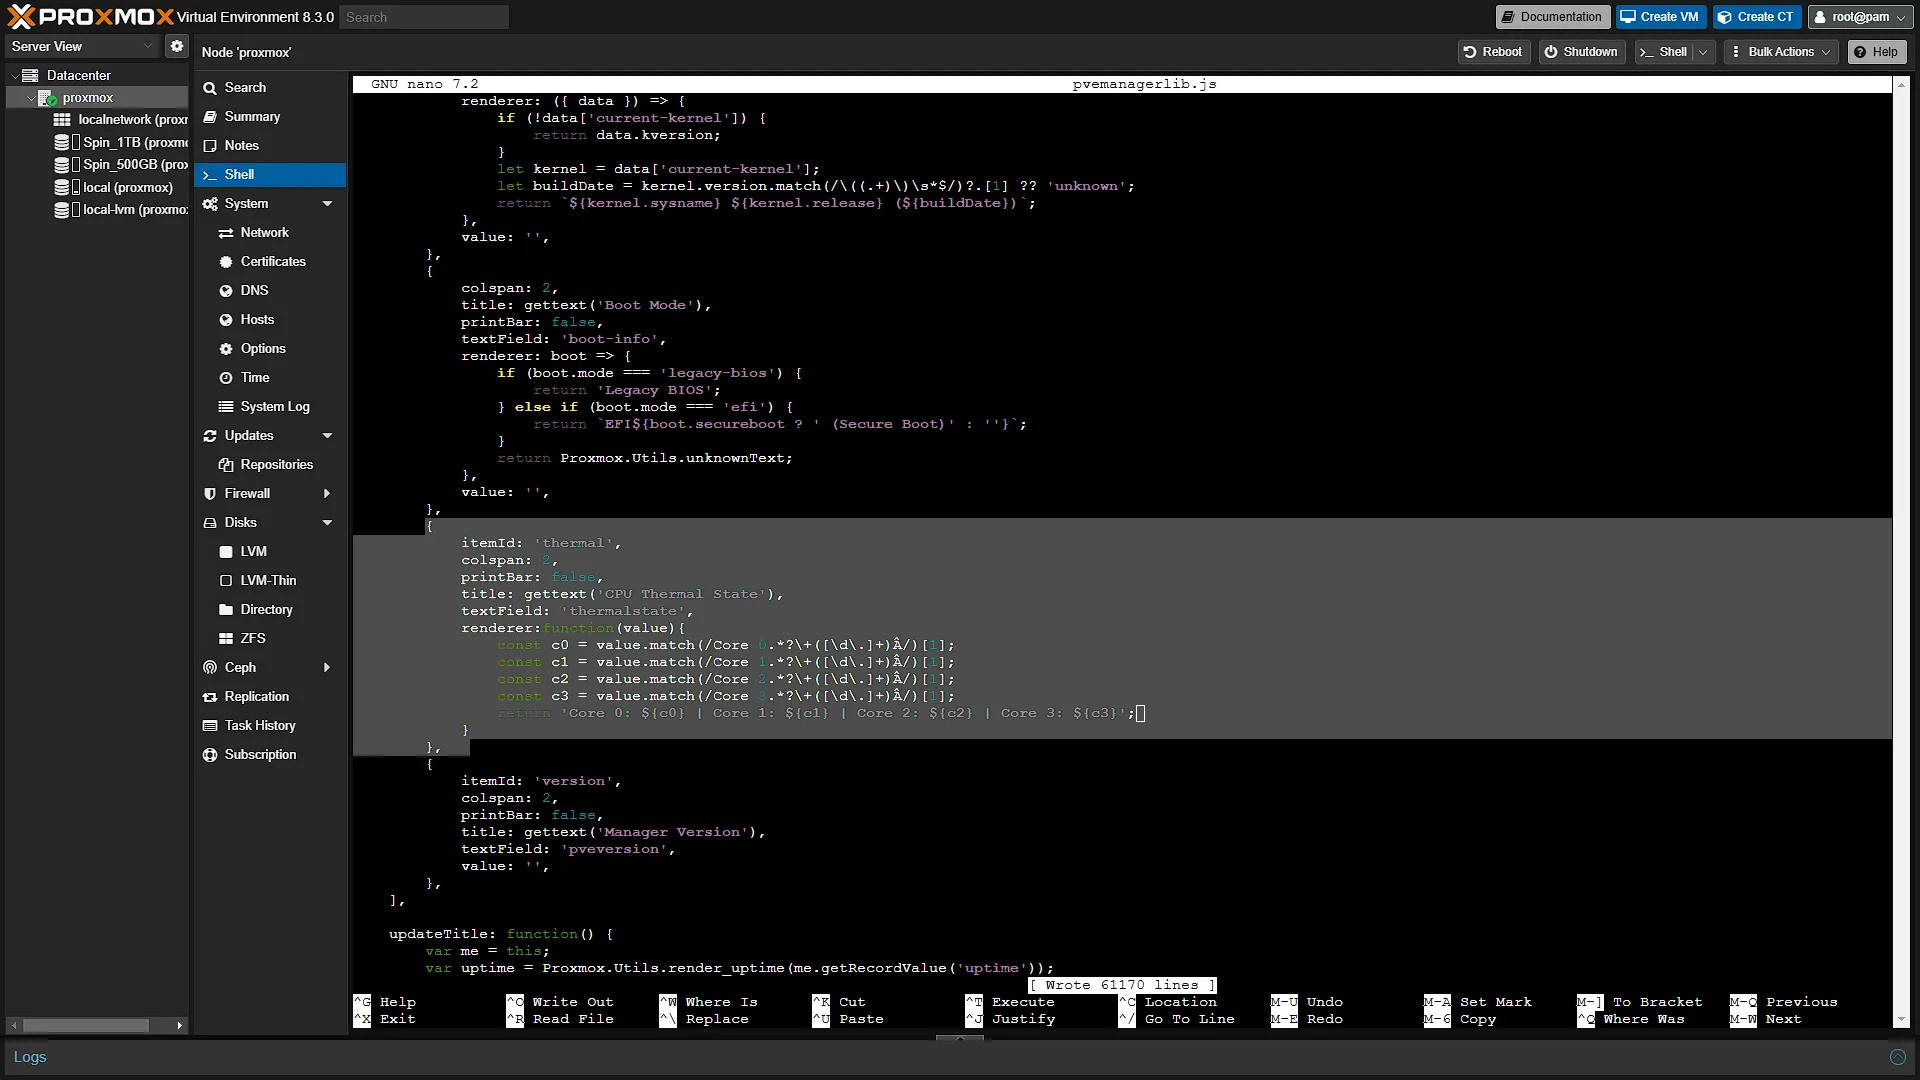
Everything between the opening { and closing } is considered a code block, and in this case, one item to display on the summary page. So we will add our code before the above. We need to add the following block:
{
       itemId: 'thermal',
       colspan: 2,
       printBar: false,
       title: gettext('CPU Thermal State'),
       textField: 'thermalstate',
       renderer:function(value){
           const c0 = value.match(/Core 0.*?\+([\d\.]+)/)[1];
           const c1 = value.match(/Core 1.*?\+([\d\.]+)/)[1];
           const c2 = value.match(/Core 2.*?\+([\d\.]+)/)[1];
           const c3 = value.match(/Core 3.*?\+([\d\.]+)/)[1];
           return `Core 0: ${c0} | Core 1: ${c1} | Core 2: ${c2} | Core 3: ${c3}`;
       }
},
The four expressions extract the number after the plus sign on the Intel Core 0 through Core 3 lines. They stop before the degree symbol. The earlier  character was a text-encoding artefact, not a required control character; the numeric pattern above works without it. This remains a four-core Intel example: inspect your own sensors output before adapting labels or the number of cores.
Note also the return line has backtick characters again in stead of single quotes. If you use normal single quotes, you will not see the actual temp and rather see ${c0} as the temp.
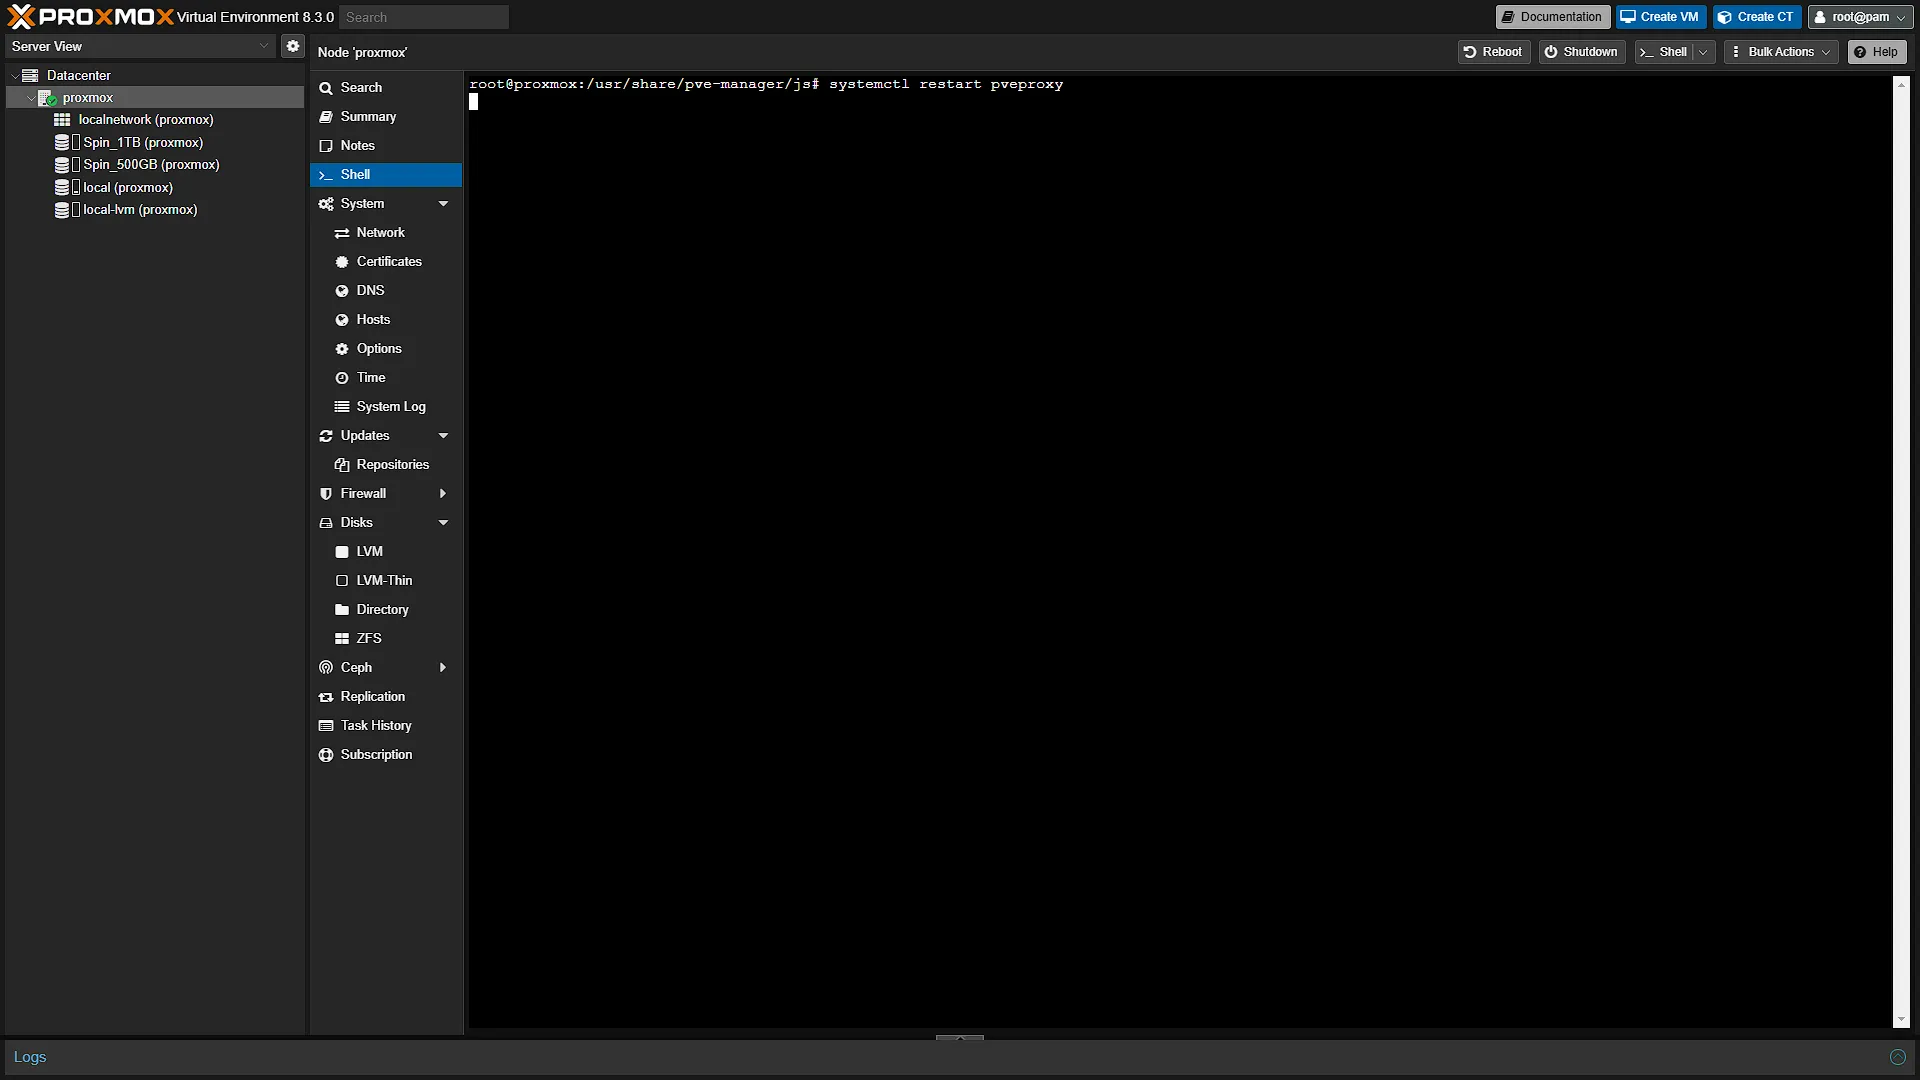
Once done, again press Ctrl+S and then Ctrl+X. TO refresh the display we need to run the following command:
systemctl restart pveproxy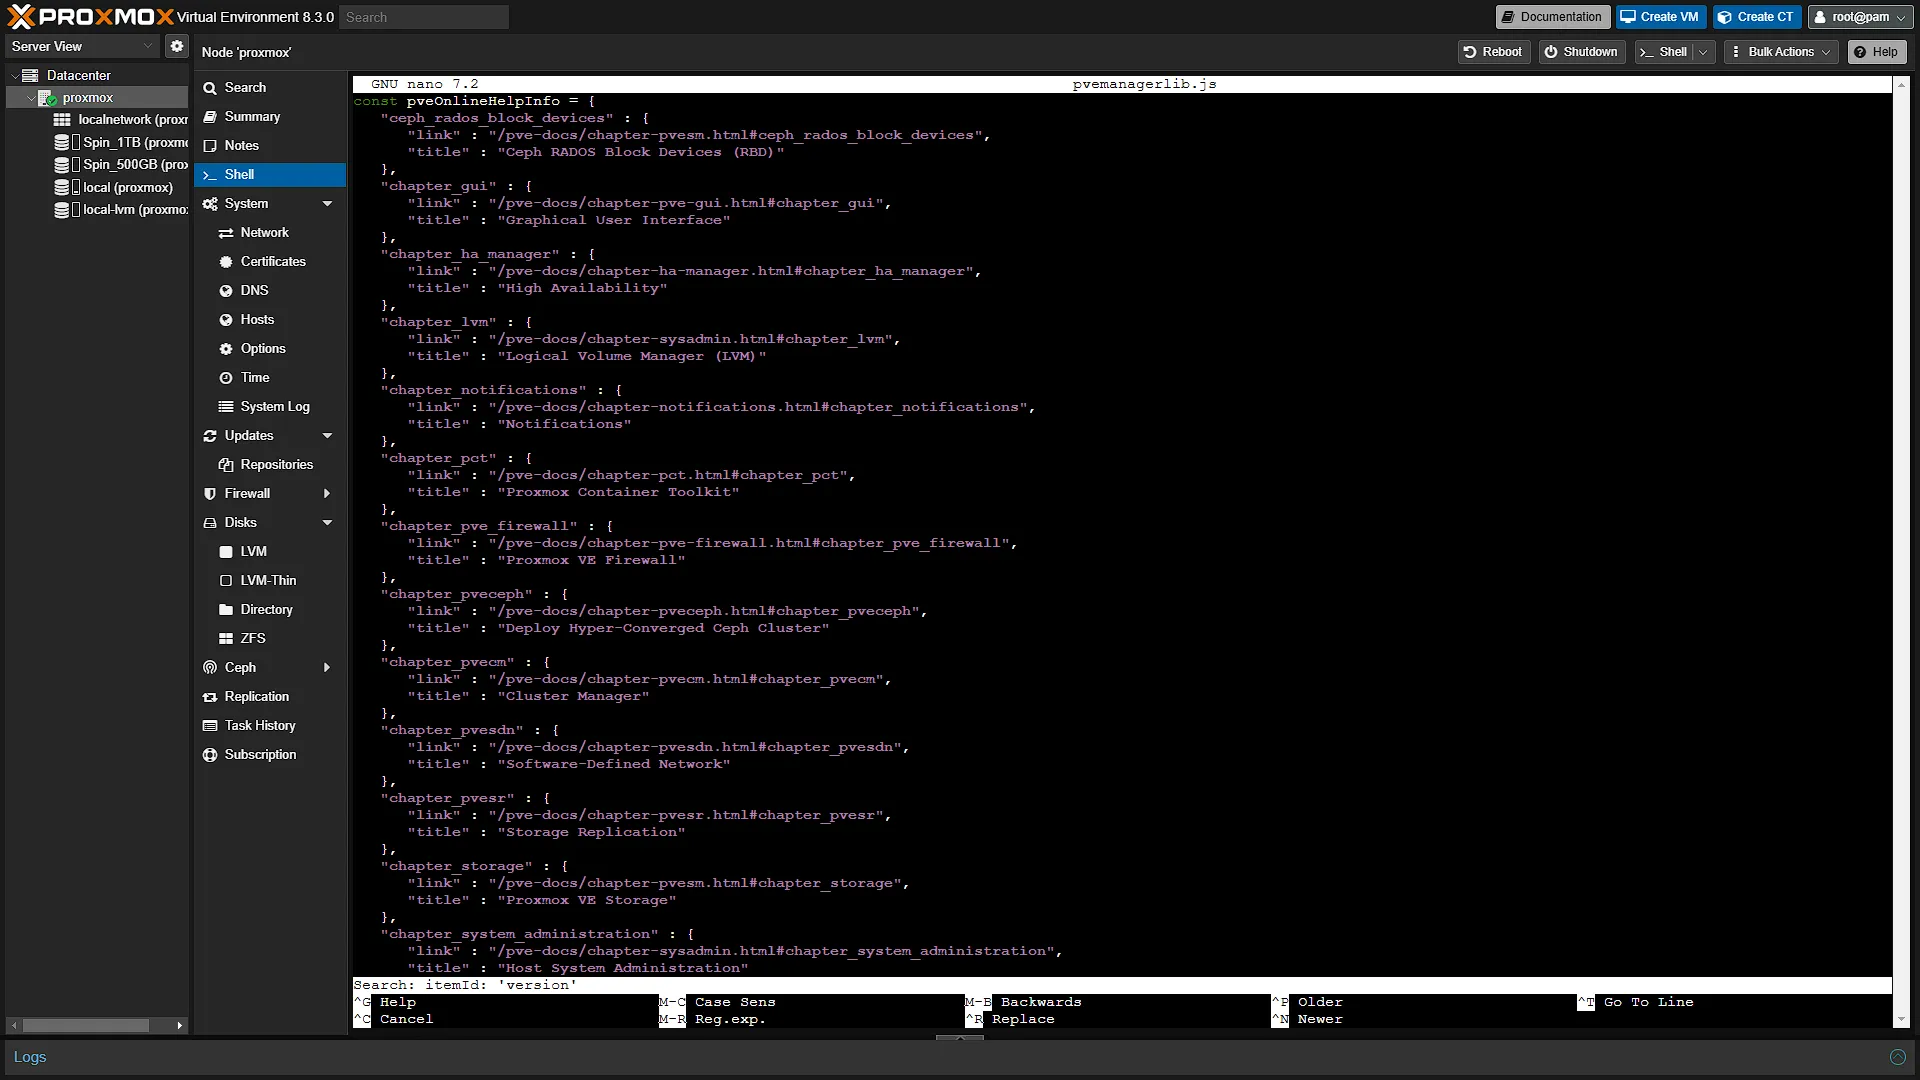
You can now safely navigate to the Summary node again in the middle navigation pane. If you do not see the new text, close your browser and log in again, or just press Ctrl+F5.
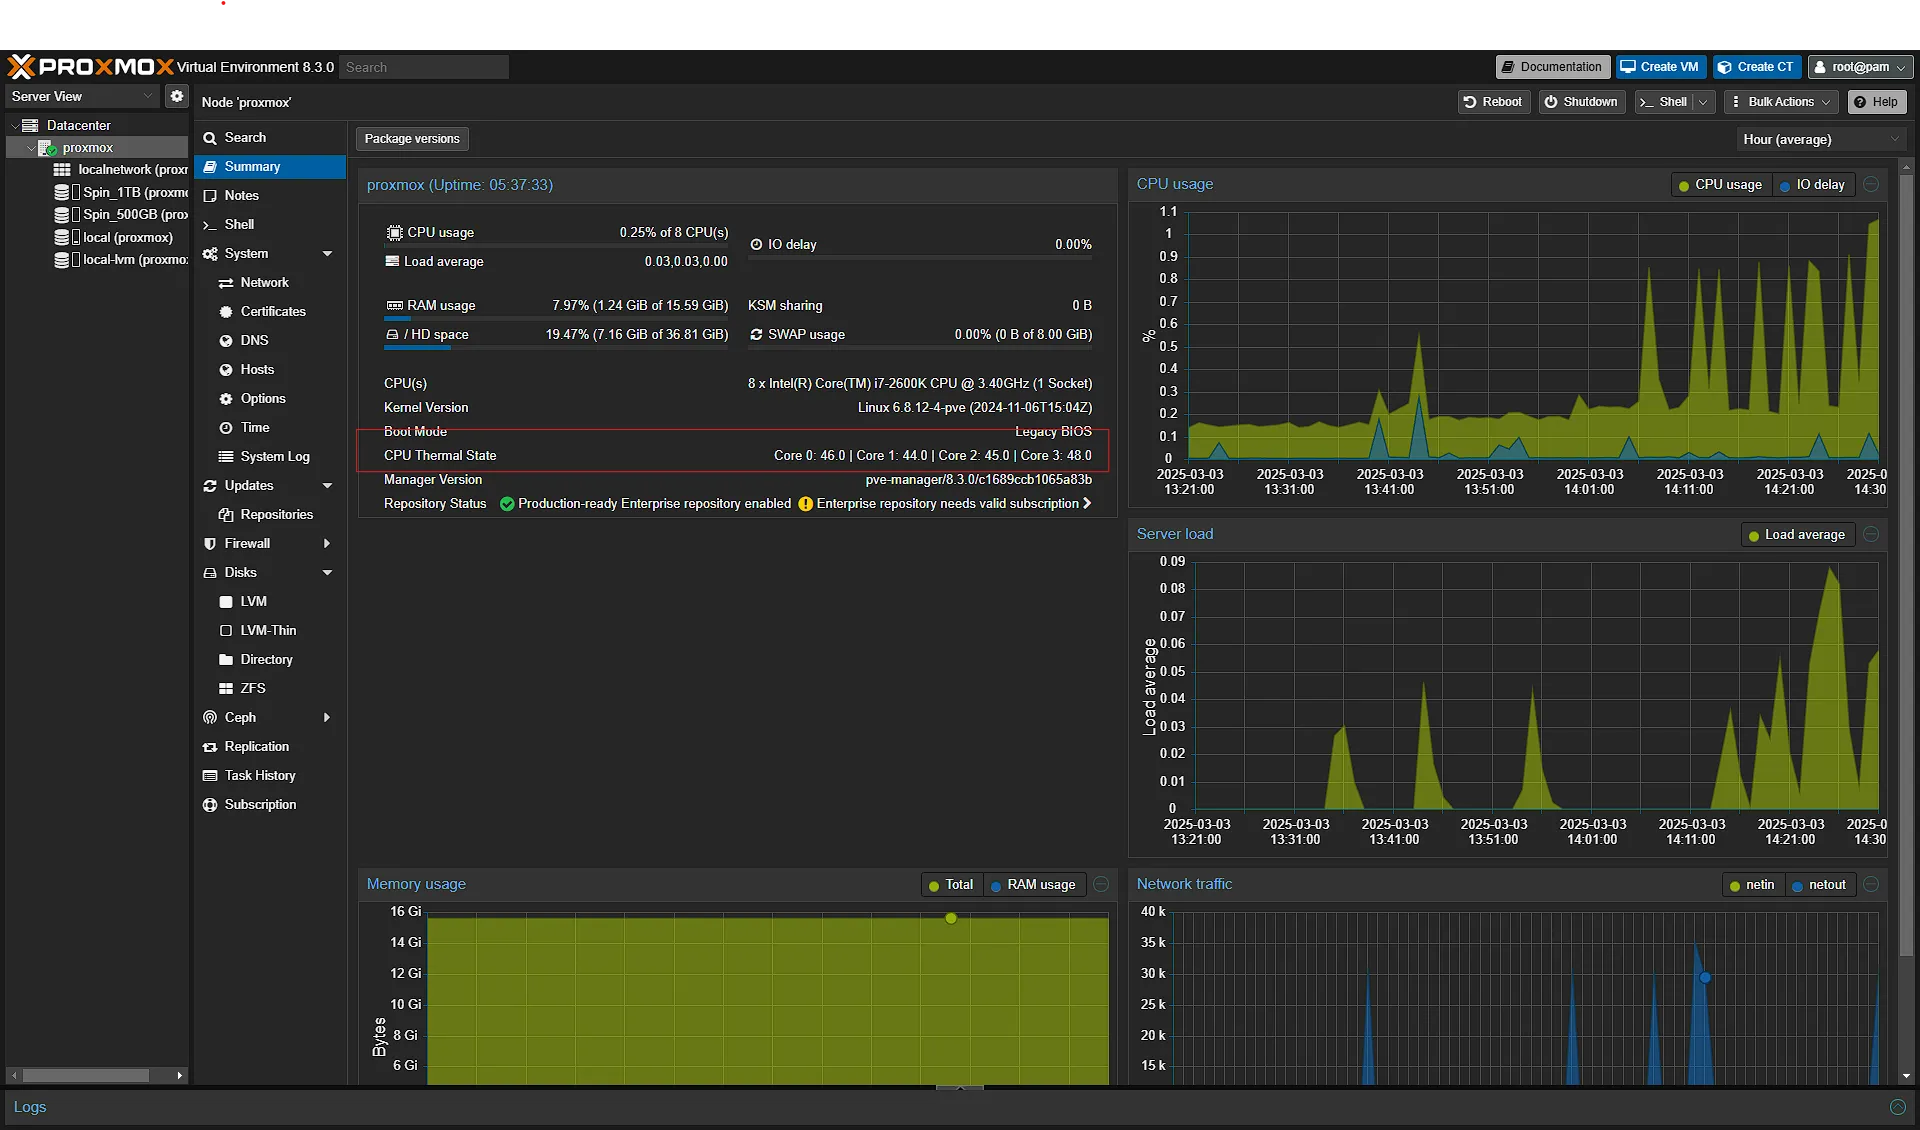
You should see the new display on your summary page:
Optional After the Walkthrough: Backup, Recovery and Sensor Compatibility
This is a manual interface modification demonstrated on Proxmox VE 8.3 with a four-core Intel processor. The displayed core names and insertion points are version-specific. A different CPU may report different labels; a later Proxmox package may change the surrounding code. First confirm that sensors returns the four lines used by the renderer. Do not apply its array indexing unchanged if a label is missing, because a failed match would make that renderer throw an error.
Before the main edits, back up the two files actually edited in this walkthrough. Run these in the Proxmox node shell, not a guest console. Keep the copies associated with the package version you backed up:
cp /usr/share/perl5/PVE/API2/Nodes.pm ~/Nodes.pm.bak
cp /usr/share/pve-manager/js/pvemanagerlib.js ~/pvemanagerlib.js.bak
If the modification breaks the interface before any package upgrade, use a working SSH or local console to restore those copies to the same paths, then restart pveproxy as shown above. A browser refresh can clear stale JavaScript, but cannot repair a syntax error. Inspect the service log if access still fails. Keep an independent console available before editing the dashboard used to manage the host.
Package updates can replace these files. After an update, inspect the new files and repeat the comparison rather than copying an old complete file over a new package version. Exporter-based monitoring in Parts 13 and 14 avoids editing this particular UI, but it still needs maintenance and compatible metrics. It is not an update-proof promise.
AMD and storage-device temperatures need their own labels and a renderer that handles absent readings. The photographed Intel values are preserved here; they are not universal alarm thresholds. Check the CPU/device specifications and compare idle and loaded readings on your own system before deciding when to investigate cooling.
Further reading: Linux coretemp driver.
Conclusion
In summary, setting up CPU temperature monitoring in Proxmox is a crucial step in managing your homelab efficiently, ensuring your hardware runs optimally 24/7. By installing the necessary package, modifying system files, and integrating thermal data into the summary page, you can easily keep an eye on temperature fluctuations. This allows for better resource management and proactive maintenance. While automation for alerts is beyond today's scope, this setup provides a solid foundation for monitoring your system in real-time. Now, you can stay informed about your homelab’s thermal state at a glance!